Journal of Neuroinflammation volume 22, Article number: 93 (2025) Cite this article
TREM2, a microglia-specific receptor, is strongly associated with Alzheimer’s disease (AD) risk, mediating microglial responses to amyloid pathology critical to AD development. However, its role in tau pathology and neurodegeneration remains unclear. Using the PS19 tauopathy mouse model with inducible overexpression of human wild-type TREM2 (TREM2-WT) or the R47H variant (TREM2-R47H), we show that increasing TREM2-WT expression modestly reduces soluble phosphorylated tau levels and mildly preserves neuronal integrity. Single-cell RNA sequencing reveals that TREM2-WT robustly enhances microglial activation, characterized by a disease-associated microglia (DAM) signature. In contrast, TREM2-R47H overexpression exhibits a loss-of-function phenotype, with no significant impact on tau levels, neurodegeneration, or microglial activation. These findings highlight the role of TREM2 in modulating microglial activity and its influence on tau pathology and neurodegeneration, providing important insights for the future development of therapies targeting TREM2 or microglial pathways in AD or other tauopathies.
Alzheimer’s disease (AD) is a chronic neurodegenerative disorder characterized by the deposition of extracellular amyloid-β (Aβ) plaques and the accumulation of neurofibrillary tangles composed of aggregated tau proteins within neurons [1, 2]. A hallmark of AD pathology is the activation of microglia, particularly around amyloid plaques [3]. Genetic studies have identified several immune-related genes as risk factors for late-onset AD, with the triggering receptor expressed on myeloid cells 2 (TREM2) among the most significant. TREM2 variants such as TREM2-R47H substantially increase the risk of developing late-onset AD [4, 5].
TREM2 is a cell surface receptor in the immunoglobulin superfamily, predominantly expressed in myeloid cells such as microglia in the brain [6]. When bound to its ligands such as lipids, apolipoprotein E (APOE), and Aβ, TREM2 initiates signaling through its adaptor proteins, DAP12 or DAP10, activating downstream pathways that regulate microglial survival and activation [7,8,9,10,11,12,13]. Multiple studies have shown that TREM2 is a key driver of disease-associated microglia (DAM) phenotypes, playing a critical role in microglial responses to Aβ, including its seeding and clearance [14,15,16,17]. TREM2 deficiency restricts microglia in a homeostatic state and dampens their response to pathological cues like Aβ [15, 16, 18]. On the other hand, elevating TREM2 levels [17, 19] or signaling [20, 21] ameliorates amyloid pathogenesis, particularly in the early stage of amyloid development, with TREM2-R47H exhibiting a loss-of-function effect. Additionally, TREM2 agonist antibody activates microglia and reduces amyloid burden in amyloid mouse models [22,23,24], suggesting a promising therapeutic potential for AD treatment.
While the role of TREM2 in Aβ pathology is well-documented, its influence on tau pathology remains controversial. Some studies suggest that TREM2 knockout (KO) or the TREM2-R47H variant has a protective effect by reducing tau pathology through dampened microglial responses [25, 26]. On the other hand, sustained microglial activation via TREM2 agonist antibody treatment has been shown to exacerbate Aβ-induced tau pathology [27]. Conversely, other studies indicate that TREM2 deletion exacerbates tau accumulation and spreading, while promoting brain atrophy, suggesting a protective role for TREM2 signaling in tau pathogenesis [28,29,30]. Notably, two other studies found that complete deletion of the murine Trem2 gene does not significantly affect tau pathology in PS19 mice [26, 31]. These conflicting results point to the need for further research to clarify whether targeting TREM2 could have therapeutic potential in influencing tau pathology and related neurodegeneration.
To address this, we employed microglia-specific inducible mouse models with controlled expression of either human wild-type TREM2 (TREM2-WT) or the R47H variant (TREM2-R47H). Previously, using these inducible mice on a 5xFAD background, we demonstrated that elevating TREM2 expression mitigates early amyloid development [17]. In this study, we crossed these TREM2-inducible mice with PS19 tauopathy models. Our findings show that increased TREM2-WT expression mildly reduced phosphorylated tau levels and neurodegeneration, accompanied by significant DAM activation revealed by single cell RNA sequencing (scRNA-seq). In contrast, elevated TREM2-R47H expression exhibited a loss-of-function phenotype, showing no significant effects on tau pathology or DAM activation. Collectively, our study suggests that enhancing TREM2 expression activates microglia and provides modest protective effects on tau pathology and neuronal integrity.
The cell-type-specific inducible human TREM2-WT or TREM2-R47H mouse models were generated by a knock-in strategy targeting the Rosa26 locus as previously described [17]. To establish microglial-specific TREM2 expressing animal models in tau background, the inducible TREM2-WT and TREM2-R47H mice were bred with Cx3cr1CreER mice (stock# 021160; The Jackson Laboratory), and further crossed with PS19 (with MAPT-P301S mutation) model mice (stock# 008169; The Jackson Laboratory) and established MAPT-P301S+/-; TREM2-WT+/+; Cx3cr1CreER/+ mice (referred to as PS19-TREM2-WT) and MAPT-P301S+/-; TREM2-R47H+/+; Cx3cr1CreER/+ mice (referred to as PS19-TREM2-R47H).
To induce the expression of TREM2-WT or TREM2-R47H, the mice at 1.5 months of age were administered two doses of 250 mg/kg tamoxifen via gavage, with a separation of 48-hour between doses (referred to as induced) [32]. The control groups received an equivalent volume of corn oil (referred to as Ctrl). Both male and female mice were used in the experiments. The animal housing conditions were in accordance with the Guide for the Care and Use of Laboratory Animals (temperature of 68–79 °F; 30–70% relative humidity).
Mice were deeply anesthetized with isoflurane prior to transcardial perfusion with Phosphate Buffered saline (PBS, Cat# BP39920, Fisher BioReagents). The brains were extracted and divided along the midline. For immunostaining analyses, one-half of the brain was fixed in 4% paraformaldehyde (PFA, Cat# sc-281692, Santa Cruz) at 4 °C overnight and then transferred to 30% sucrose (Cat# S7903, Sigma-Aldrich) solution for 48 h. The tissues were subsequently embedded in O.C.T. compound (Cat# 23-730-571, Fisher Healthcare) and snap-frozen in liquid nitrogen prior to cryostat sectioning. The other half of the brain was dissected to isolate the cortical and hippocampal regions, which were snap-frozen in liquid nitrogen and kept at -80 °C until used for extraction and biochemical analyses. A three-step sequential extraction process was conducted. First, brain tissues were homogenized and lysed in RAB buffer (Cat# 786 − 91, G-Biosciences), supplemented with protease inhibitor (Cat# 11697498001, cOmplete, Roche) and phosphatase inhibitor (Cat# 4906845001, PhosSTOP, Roche). The homogenates were centrifuged at 50,000 × g for 20 min at 4 °C, and the resulting supernatants were collected as RAB-soluble fractions. The pellets were re-suspended in RIPA buffer (Cat# 20–188, Millipore) with added protease inhibitor (Cat# 11697498001, cOmplete, Roche) and phosphatase inhibitor (Cat# 4906845001, PhosSTOP, Roche), followed by centrifugation at 50,000 × g for 20 min at 4 °C. The supernatants from this step were collected as RIPA-soluble fractions. Finally, the remaining pellets were suspended in 70% formic acid (FA) and centrifuged again at 50,000 × g for 20 min at 4 °C. The supernatants were collected as FA fractions. All extracted fractions were stored at -80 °C until used for western blot and ELISA analyses.
Equal amounts of protein from the RAB and RIPA fractions were resolved by SDS-polyacrylamide gel electrophoresis (SDS-PAGE) and transferred onto polyvinylidene difluoride membranes (PVDF, Cat# IPFL00010, Millipore). After blocking with 5% nonfat milk, the membrane was incubated with primary antibodies at 4 °C overnight and horseradish peroxidase (HRP)-conjugated secondary antibodies at room temperature for 1 h. Chemiluminescence was detected using ECL Substrate (Pierce). Immunoblots were visualized using the Bio-Rad ChemiDoc MP imaging system. The following primary antibodies were used: anti-human TREM2 (Cat# 91068, Cell Signaling Technology, 1:1,000), and anti-β-actin (Cat# A2228, Sigma-Aldrich, 1:2,000) antibodies.
The levels of total tau in RAB, RIPA and FA fractions were quantified by sandwich ELISA as previously described [33], using a monoclonal tau antibody (HT7, Cat# MN1000, Thermo Scientific) as the capture antibody and a biotin-conjugated tau antibody (BT2, Cat# MN1010B, Thermo Scientific) as the detection antibody. Phospho-tau (pT181) was determined by Phospho-Tau ELISA Kit (Cat# KHO0631, Thermo Scientific) according to the manufacturer’s instruction. Briefly, standards and samples were diluted with Standard Diluent Buffer and added into the antibody-coated plate. Then, add 50 µL Detection Antibody solution into each well and incubated overnight at 4 °C. After washing, the plate was incubated with 100 µL 1X Anti-Rabbit IgG HRP solution for 30 min. After washing, add 100 µL Stabilized Chromogen to each well. After incubating for 30 min at room temperature in the dark, add 100 µL Stop Solution to each well and read the absorbance at 450 nm.
Brain sections (40 μm thickness; coronal) were collected from the same brain region for all the animals, and brain regions were confirmed under the microscope by comparing sections to images on the Allen Mouse Brain Atlas (http://mouse.brain-map.org). The sections were placed into a 48-well plate for free-floating immunostaining. After blocked in 5% goat serum (Cat# S-1000, Vector Laboratories) for 1 h, sections were incubated with the primary antibodies overnight. Sections were then incubated with Alexa Fluor-conjugated secondary antibodies for 2 h at room temperature (1:1,000; Invitrogen). The following primary antibodies were used: anti-phospho-tau at site Ser202 and Thr205 (Cat# MN1020, AT8, Thermo Fisher Scientific, 1:500); anti-human TREM2 (16E1, produced in-house at Mayo Clinic, 1:500) [17]; anti-IBA1 (Cat# 019-19741, Wako, 1:1,000); anti-NeuN (Cat# MAB377, clone A60, Millipore, 1:1,000); anti-Galectin 3 (Cat# 14-5301-82, Thermo Fisher Scientific,1:300), MC-1 (1:100, gift from Dr. Peter Davies [34]).
Immunofluorescence images were acquired using a Carl Zeiss (LSM800) confocal microscope at 20X magnification with consistent laser and detector settings. 30-µm Z-stacks (20 optical slices, 1.5-µm thickness each) were collected, and maximum intensity projections were generated. Other fluorescent images were captured using Keyence (BZ-X810) or Phenoimager HT microscopes at 20X magnification, with autofocus performed under identical settings within each experiment. For each staining, the hippocampus and piriform cortex were manually traced and saved as Regions of Interest (ROIs) using ImageJ. A unified intensity threshold was applied across all samples within each staining. Pixels exceeding this threshold were quantified to determine the percentage of positive immunoreactive area using the particle analysis plugin. The thickness of the layered hippocampal structures CA1 and DG was determined by measuring the average width of each structure using ImageJ.
Total RNA was isolated by using Trizol (Cat# 15596018, Thermo Fisher Scientific), RNeasy Mini Kit (Cat# 74104, QIAGEN) and subjected to DNase I (Cat# 79254, QIAGEN) digestion to remove contaminating genomic DNA. Reverse transcription was performed using iScript™ Reverse Transcription Supermix (Cat# 1708891, Bio-Rad). cDNA was added to a reaction mix (10 µL final volume) containing gene-specific primers and SYBR green supermix (Cat# 172–5274, Bio-Rad). All samples were run in duplicates and were analyzed with QuantStudio 7 Flex Real-Time PCR System (Thermo Fisher Scientific). The relative gene expression was normalized to actin controls and assessed using the 2−ΔΔCT method. Primer sequences and information are as follows (5′-3′): murine actin: 5′- AGTGTGACGTTGACATCCGTA-3′ (forward) and 5′-GCCAGAGCAGTAATCTCCTTC-3′ (reverse); human TREM2: 5′-GCTGCTCATCTTACTCTTTGTC-3′ (forward) and 5′-TCATAGGGGCAAGACACCT-3′ (reverse); murine Trem2: 5′-GCACCTCCAGGAATCAAGAG-3′ (forward) and 5′-GGGTCCAGTGAGGATCTGAA-3′ (reverse); total TREM2/Trem2: 5′-GCCCATGCCAGCGTGTGGT-3′ (forward) and 5′-CACTGGTAGAGGCCCGC-3′ (reverse).
The single cell isolation and scRNA-seq analyses were performed as we described [17]. Briefly, isoflurane was used to anesthetize mice before transcardial perfusion with PBS. The cortical tissues were quickly dissected and enzymatically digested using the Neural Tissue Dissociation kit (P) (Cat# 130-092-628, Miltenyi Biotec). Myelin was removed using magnetic bead separation (Myelin Removal Beads II, Cat# 130-096-733, Miltenyi Biotec) followed by the red blood cell lysis (Cat# 130-094-183; Miltenyi Biotec) and dead cell removal (Cat# 130-090-101; Miltenyi Biotec) according to the manufacturer’s instructions. The final cell pellet was suspended in Ca/Mg-free PBS supplemented with 0.5% FBS. Trypan blue examination confirmed that over 90% of the cells were viable in each sample.
ScRNA-seq was conducted using the Chromium platform (10x Genomics) with the 3′ Gene Expression V3 kit, targeting an input of approximately 7,000 cells per sample. In summary, gel beads in emulsions (GEMs) were generated on the sample chip using the Chromium Controller. Barcoded cDNA was extracted from the GEMs through Post-GEM RT-cleanup and subsequently amplified for 12 cycles. The amplified cDNA underwent fragmentation, end-repair, poly-A tailing, adaptor ligation, and 10x-specific sample indexing according to the manufacturer’s protocol. Library quality was assessed using the TapeStation (Agilent), and libraries were sequenced on a HiSeq 4000 instrument (Illumina), aiming for a sequencing depth of 25,000 to 50,000 reads per cell.
scRNA-seq data were processed using the standard 10x Genomics Cell Ranger Single Cell Software Suite (v3.0.0). In brief, raw sequencing reads were demultiplexed, aligned to the mm10 reference mouse genome, and the reads aligned to each gene were counted. Cell filtration, normalization, clustering and differential expression analyses were performed using standard Seurat package procedures (v.4.0) with default parameter settings. For quality control, cells that had unique gene counts over 6,000 or less than 200 and > 20% mitochondrial content were removed. SCTransform was used to normalize and scale data and to remove the confounding sources of variation of sequencing depth, mitochondria gene percentage, and ribosomal protein gene percentage. All samples were integrated, and canonical correlation analysis was performed to identify common sources of variation among samples and to remove batch effects. The first 30 canonical correlation vectors were used for subsequent clustering analysis and visualization using UMAP. Function “FindAllMarkers” was used to identify cluster-specific genes. Cell clusters were manually annotated as specific cell types based on literature and the datasets for murine cell taxonomy. Cell doublets that expressed more than one cell type marker were excluded from downstream analyses.
The microglia cell clusters were further classified into HM, DAM, IRM, REM, MHCII+, and CPM based on the expression patterns of marker genes [15, 16, 35]. Differentially expressed genes (DEGs) in each pairwise comparison within microglia clusters (PS19-TREM2-WT-induced versus Ctrl or PS19-TREM2-R47H-induced versus Ctrl) were calculated using the MAST test while correcting for sex effects. Genes with adjusted P < 0.05 and average log 2 fold change > = 1 were defined as significant DEGs. Gene Ontology (GO) enrichment analysis of DEGs from each cluster was performed using R package clusterProfiler [36, 37].
All data were reported as mean values ± SEM unless otherwise indicated. Generally, to ensure that results were valid in the presence of non-normal distributions, or differing variances between groups, nonparametric Mann-Whitney test was used to compare outcomes among groups when sample size is larger than 10. With the sample size ≤ 10, since nonparametric tests would have very low power, a Student’s t test was used to compare outcomes among groups. Statistics were analyzed using GraphPad Prism v10.0.0. All statistical tests were two-sided. The statistical tests used for each analysis, the sample size, and the significance levels were reported in the caption of each figure.
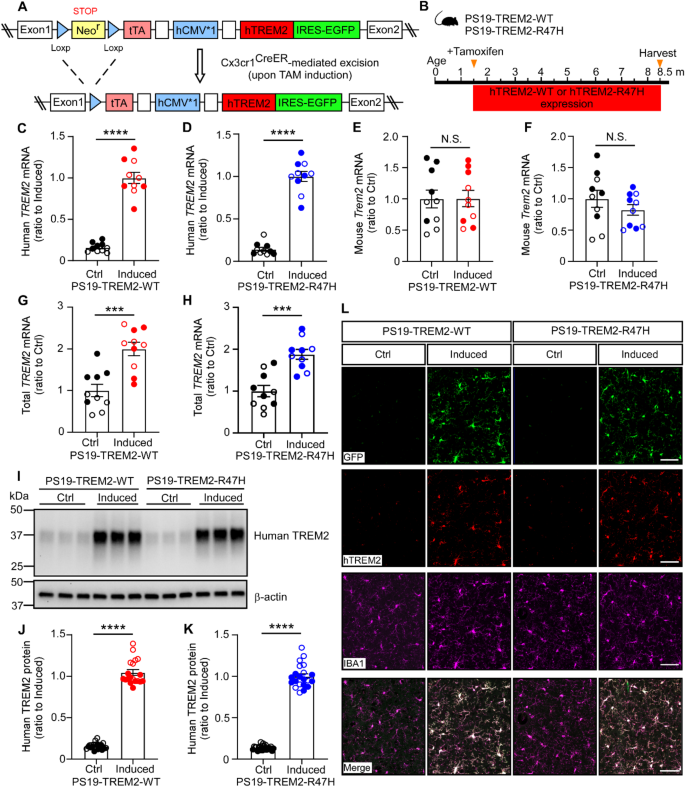
To investigate the effects of human TREM2 on microglial function, we previously generated inducible mouse models that conditionally express human TREM2-WT or TREM2-R47H in a cell-type-specific manner using a Cre-loxP knock-in strategy targeting the Rosa26 locus [17]. An enhanced green fluorescent protein (EGFP) cDNA was included and expressed under the control of an internal ribosomal entry site, serving as a surrogate marker for human TREM2 expression. These mouse models were then crossed with Cx3cr1CreER/+ mice to enable microglia-specific expression of human TREM2-WT or TREM2-R47H, along with EGFP, upon tamoxifen (TAM) treatment (Fig. 1A). To further examine the impact of human TREM2-WT and TREM2-R47H on tau pathology and associated neurodegeneration, we crossed the microglia-specific TREM2-WT and TREM2-R47H mice with the PS19 tauopathy model carrying the human MAPT-P301S mutation. This generated MAPT-P301S+/-; TREM2-WT+/+; Cx3cr1CreER/+ (referred to as PS19-TREM2-WT) and MAPT-P301S+/-; TREM2-R47H+/+; Cx3cr1CreER/+ (referred to as PS19-TREM2-R47H) mice (Fig. 1B). In PS19 mice, pathological tau seeding is detected as early as 1.5 months [38], and synapse loss occurs by 3 months of age [39]. To ensure TREM2 expression is induced early enough to coincide with tau seeding and before neurodegeneration begins, while also avoiding potential effects on early brain development, we selected 1.5 months of age as the induction time point. These mice were subjected to either vehicle (referred to as “Ctrl” group) or TAM (referred to as “Induced” group) administration at 1.5 months of age and harvested at 8.5 months of age (Fig. 1B).
Using these new mouse models, we first confirmed significantly higher mRNA levels of human TREM2-WT or TREM2-R47H in the induced groups compared to their respective Ctrl groups (Fig. 1C, D). The levels of endogenous murine Trem2 mRNA remained comparable between the Ctrl and induced groups for both TREM2-WT and TREM2-R47H mice (Fig. 1E, F). Using primers designed to detect both human TREM2 and murine Trem2 with equal efficiency, thereby reflecting total TREM2 levels, we found that the induced groups exhibited approximately double the total TREM2 mRNA levels compared to the Ctrl groups in both TREM2-WT and TREM2-R47H mice (Fig. 1G, H), consistent with our earlier findings [17]. Western blotting analysis further confirmed significantly elevated human TREM2 protein levels in cortical brain RIPA lysates from the induced mice (Fig. 1I–K). As reported by previous studies using the Cx3cr1CreER mice [40], we observed approximately 10% spontaneous recombination in the absence of tamoxifen (TAM), evidenced by the qPCR (Fig. 1C, D) and the Western blot signal (Fig. 1I-K) in the control groups. Finally, immunofluorescence co-staining demonstrated that TREM2 and GFP colocalized exclusively with microglia marker Iba1, confirming microglia-specific expression of human TREM2 in our mouse models as designed (Fig. 1L).
Characterization of microglia-specific PS19-TREM2 inducible mouse models
(A) Schematic illustrative of the inducible expression of TREM2-WT or TREM2-R47H knock-in alleles. The TREM2 floxed mice were bred with the Cx3cr1CreER mice to generate TREM2-WT (TREM2-WT+/+; Cx3cr1CreER/+) or TREM2-R47H (TREM2-R47H+/+; Cx3cr1CreER/+) mice. Administration of tamoxifen to these mice led to the removal of the loxP-flanked Neor gene and expression of human TREM2-WT or TREM2-R47H in microglia. (B) Illustration of induction paradigms for the expression of human TREM2-WT or TREM2-R47H in the PS19 background. (C-H) The mRNA levels of human TREM2 (C and D), mouse Trem2 (E and F), and total TREM2 (human + mouse; G and H) in the brain were quantified by qPCR. n = 10 mice/group (mixed sexes). In C–H, each datapoint (circle) represents an individual animal, male and female mice are labeled as solid and open circles, respectively. Two-tailed unpaired Student’s t tests with Bonferroni correction were used for statistical analysis. P values < 0.05 were considered to be statistically significant. ***, P < 0.001; ****, P < 0.0001; N.S., not significant. Data are mean ± SEM. (I-K) The protein levels of human TREM2 in the cortical RIPA lysate were quantified by western blot. n = 19–23 mice/group (mixed sexes). In J-K, each datapoint (circle) represents an individual animal, male and female mice are labeled as solid and open circles, respectively. Mann − Whitney tests followed by Bonferroni correction for multiple comparisons were used for statistical analysis. P values < 0.05 were considered to be statistically significant. ****, P < 0.0001; N.S., not significant. Data are mean ± SEM. (L) Representative images of the GFP, human TREM2, and IBA1 co-staining. Scale bar, 50 μm.
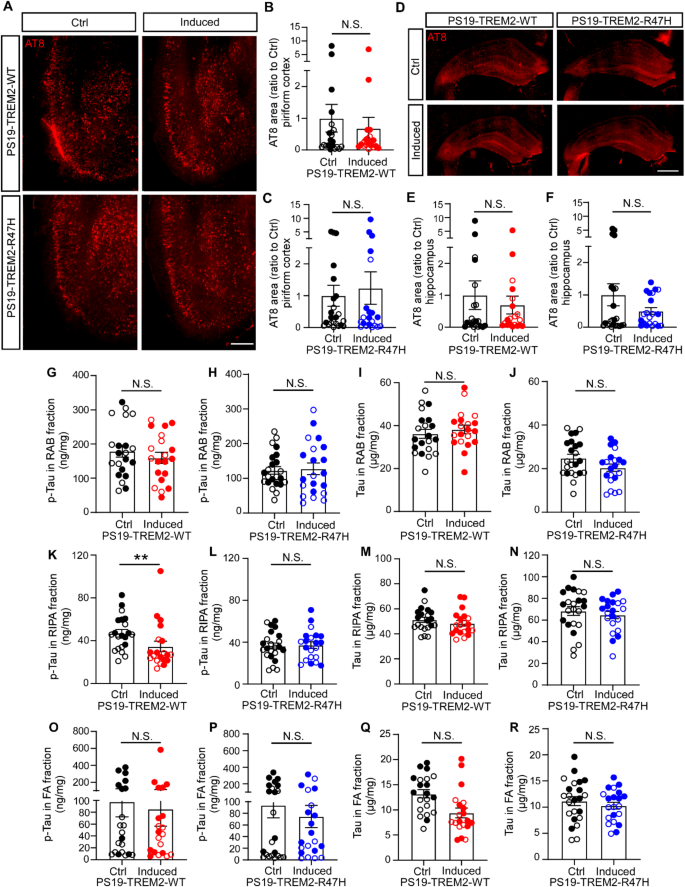
To evaluate tau pathology, we performed immunofluorescence staining for phosphorylated tau (p-tau) using the AT8 antibody on PS19-TREM2 mice at 8.5 months of age. Profound p-tau + pathology was observed in the piriform cortex and hippocampus, consistent with previous reports using the PS19 mouse model [26, 39, 41]. We did not detect significant differences in tau pathology between the PS19-TREM2-WT induced and control groups or between the PS19-TREM2-R47H induced and control groups, in either the piriform cortex (Fig. 2A-C) or the hippocampus (Fig. 2D-F). We also performed immunostaining using the MC-1 antibody, which targets a pathological conformation of tau [34]. Our results with MC-1 are similar to AT8 stanning, showing no significant differences in tau pathology between control and induced groups for both PS19-TREM2-WT and PS19-TREM2-R47H mice (Supplementary Fig. 1A-F). Furthermore, a correlation analysis confirmed a strong positive correlation between AT8 and MC-1 staining results, reinforcing the reliability of our observations (Supplementary Fig. 1G and H). Additionally, we measured the levels of soluble and insoluble p-tau and total tau using ELISA in three brain lysate fractions, including the RAB buffer soluble fraction, RIPA detergent soluble fraction, and formic acid (FA) detergent insoluble fraction (Fig. 2G-R). We found no significant differences in RAB and FA fractions for both p-tau and total tau levels between induced and control animals in either the PS19-TREM2-WT or PS19-TREM2-R47H groups, with the exception that the p-tau level in the RIPA fraction was significantly lower in PS19-TREM2-WT induced mice compared to control mice (Fig. 2K); however, this difference was not observed in PS19-TREM2-R47H mice (Fig. 2L). Both AT8 staining and Elisa results are consistent across female and male mice in a sex-specific analyses (Supplementary Fig. 2 and Supplementary Fig. 3). These results suggest that elevating TREM2-WT expression has a modest impact on tau pathology in our model system.
The impact of TREM2 expression on tau pathology
(A-C) Representative images of piriform cortical region (A) and quantification (B and C) of p-tau by immunofluorescence staining with AT8 antibody. Scale bar, 500 μm. (D-F) Representative images of hippocampus (D) and quantification (E and F) of p-Tau by AT8 immunofluorescence staining. Scale bar, 500 μm. (G-R) The levels of p-tau and total tau in the buffer soluble (RAB), detergent soluble (RIPA), and insoluble (FA) fractions were detected by ELISAs in the mice with or without TREM2-WT or TREM2-R47H overexpression. Sample size: n = 19–23 mice/group, with mixed sexes. Each datapoint (circle) represents an individual animal, male and female mice are labeled as solid and open circles, respectively. Data are shown as mean ± SEM. Mann–Whitney tests were used for statistical analysis. P values < 0.05 were considered to be statistically significant. **P < 0.01; N.S., not significant.
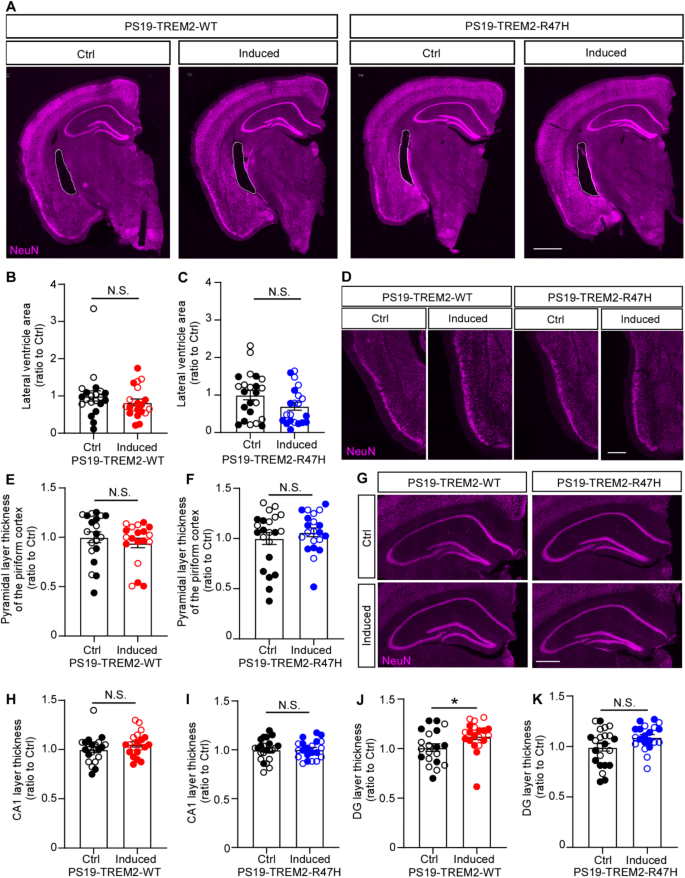
To further assess the impact of TREM2-WT and TREM2-R47H expression on neurodegeneration in PS19 mice, we conducted immunofluorescence staining for the neuronal marker NeuN and quantified the lateral ventricle area. No differences were observed in the lateral ventricle area between the induced and control groups in either PS19-TREM2-WT or PS19-TREM2-R47H mice (Fig. 3A-C). We then quantified the thickness of the pyramidal neuronal layer in the piriform cortex (Fig. 3D-F), along with neuronal layers thickness in CA1 and the dentate gyrus (DG) within the hippocampus (Fig. 3G-K). In the piriform cortex, the thickness of the pyramidal neuronal layer did not differ significantly between induced and control groups for either PS19-TREM2-WT or PS19-TREM2-R47H mice (Fig. 3D-F). Similarly, the thickness of the neuronal layer in the CA1 region showed no significant differences between the groups (Fig. 3G-I). However, a slight increase in DG layer thickness was observed in the PS19-TREM2-WT induced group compared to its control group (Fig. 3J), a difference not observed in PS19-TREM2-R47H mice (Fig. 3K).
Collectively, our data suggest that the overexpression of TREM2-WT in microglia may have a mild effect on reducing pathological tau levels (Fig. 2) and protecting against neural loss in the hippocampal DG region (Fig. 3) in our model system, whereas TREM2-R47H appears to represent a loss-of-function in these events.
The impact of TREM2 expression on neurodegeneration
NeuN immunofluorescence staining was carried out on PS19 mice expressing either TREM2-WT or TREM2-R47H. (A-B) Representative images (A) and quantification (B and C) of the lateral ventricle area in mice following the induction of TREM2-WT or TREM2-R47H expression in microglia within the PS19 background. Scale bar, 1 mm. (D-F) Representative images (D) and quantification (E and F) of the thickness of the pyramidal neuronal layer in the piriform cortex in mice upon induction of TREM2-WT or TREM2-R47H expression in microglia within the PS19 background. Scale bar, 500 μm. (G-K) Representative images (G) and quantification (H-K) of the thickness of the neuronal layers in the in mice following induction of TREM2-WT or TREM2-R47H expression in microglia within the PS19 background. Scale bar, 500 μm. Sample size: n = 19–23 mice per group, with mixed sexes. Each datapoint (circle) represents an individual animal, male and female mice are labeled as solid and open circles, respectively. Data are presented as mean ± SEM. Statistical analysis was conducted using Mann–Whitney tests. P values less than 0.05 were considered statistically significant. *P < 0.05; N.S., not significant.
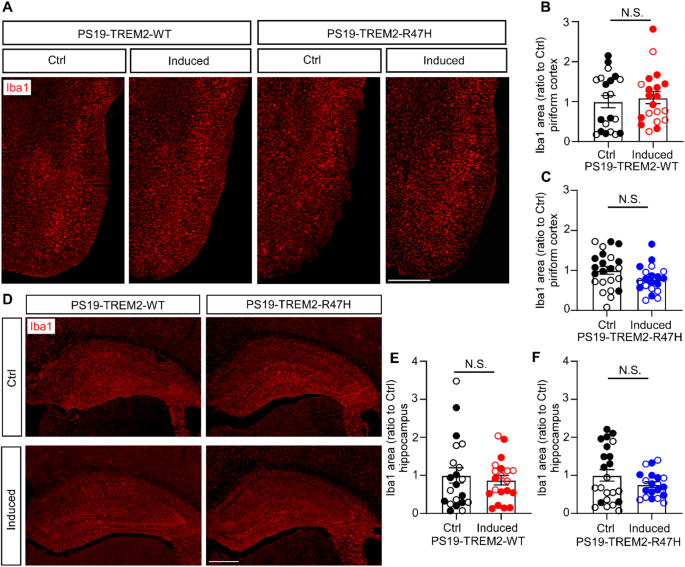
To investigate the impact of TREM2 expression on microglia in these tau models, we assessed microglia density in the piriform cortex and hippocampus using Iba1 staining. No significant differences in microglial coverage were observed between the PS19-TREM2-WT induced and control groups, or between the PS19-TREM2-R47H induced and control groups, in either the piriform cortex (Fig. 4A-C) or the hippocampus (Fig. 4D-F).
TREM2 expression does not alter microglia density
(A-C) Representative images of piriform cortical region (A) and quantification (B and C) of microgliosis by immunofluorescence staining with Iba1 antibody. Scale bar, 500 μm. (D-F) Representative images of hippocampus (D) and quantification (E and F) of microgliosis by Iba1 immunofluorescence staining. Scale bar, 500 μm. Sample size: n = 19–23 mice/group, with mixed sexes. Each datapoint (circle) represents an individual animal, male and female mice are labeled as solid and open circles, respectively. Data are shown as mean ± SEM. Mann-Whitney tests were used for statistical analysis. P values < 0.05 were considered to be statistically significant. N.S., not significant.
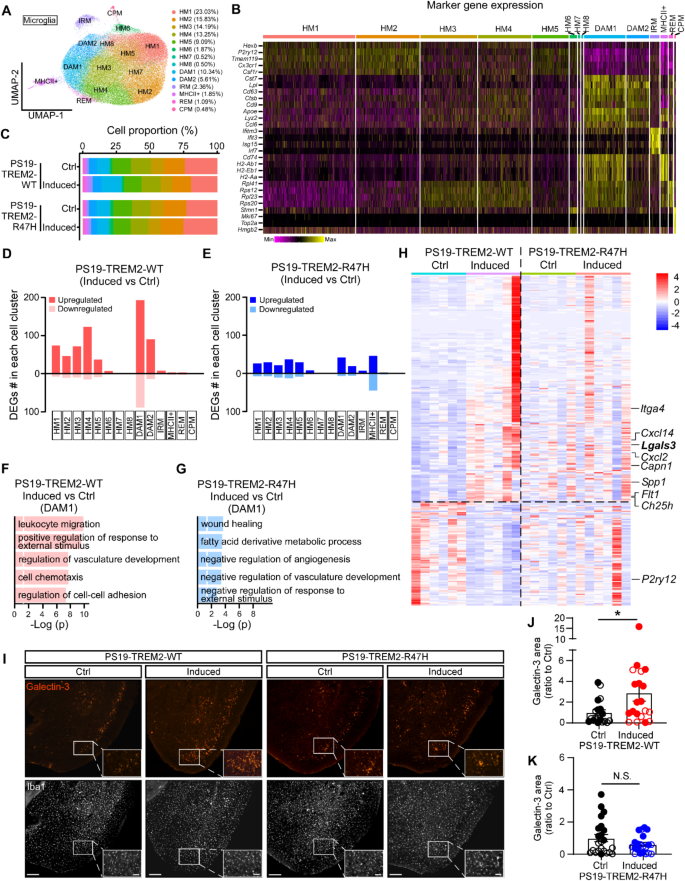
To further explore the microglial molecular signature, we isolated cortical single cells from an independent cohort of animals and performed scRNA-seq analysis, focusing on microglia population for downstream analysis (Fig. 5). After removing other cell types, we recovered a total of 105,136 microglia, which were grouped into 14 distinct clusters following unsupervised clustering. These clusters were visualized using Uniform Manifold Approximation and Projection (UMAP) (Fig. 5A). Based on published microglial subtype-specific marker gene expression data [15,16,17, 20, 42], we further identified subclusters of microglia, including the homeostatic microglia (HM1-8; high expression of Cx3cr1, P2ry12, Tmem119, and Csf1r); disease-associated microglia (DAM1 and DAM2, high expression of high expression of Tyrobp, Apoe, Ctsb, Fth1, Ccl3, Ctsl, Lpl, Cst7, and Cd9); interferon response microglia (IRM, high expression of Ifit3, Isg15, Ifitm3, and Irf7), major histocompatibility complex class II expressing microglia (MHCII+, high expression of H2-Ab1, H2-Eb1, H2-Aa and Cd74), ribosomal gene enriched microglia (REM, high expression of Rpl41, Rps12, Rpl23 and Rps20), and cycling/proliferating microglia (CPM; high expression of Stmn1,Top2a, Mki67 and Hmgb2) (Fig. 5B) [15, 20, 43]. The composition of these subclusters was similarly represented in the induced PS19-TREM2-WT and PS19-TREM2-R47H mice compared to their littermate controls (Fig. 5C).
Distinct microglial responses in PS19-TREM2-WT and PS19-TREM2-R47H mice by scRNA-seq
(A) UMAP plot showing 14 distinct microglial subclusters from PS19-TREM2-WT and PS19-TREM2-R47H mice. n = 6 mice per group (equal male and female). (B) Heatmap displaying the expression of key marker genes used to identify microglial subclusters, including homeostatic microglia (HM1-8), disease-associated microglia (DAM1 and DAM2), interferon response microglia (IRM), MHCII + microglia, ribosomal gene-enriched microglia (REM), and cycling/proliferating microglia (CPM). (C) Bar plots illustrating the proportions of microglial subclusters in each of the four groups. (D and E) Number of DEGs for all the microglia subclusters in the comparison between induced versus Ctrl groups of PS19-TREM2-WT (D) or and PS19-TREM2-R47H (E) mice. (F and G) Top five canonical pathways enriched by DEGs from DAM1 cluster in the comparison between induced versus Ctrl groups of PS19-TREM2-WT (F) or PS19-TREM2-R47H (G) mice. The threshold of significant P value is 0.05. (H) Heatmap showing the gene expression of combined DEGs in the DAM1 cluster from PS19-TREM2-WT and PS19-TREM2-R47H mice. (I) Representative images showing Galectin-3 and IBA1 staining in piriform cortical region. Scale bar is 200 μm and 50 μm for insert. (J and K) The Galectin-3 coverage areas were quantified and compared. n = 19–23 mice/group, each datapoint (circle) represents an individual animal, male and female mice are labeled as solid and open circles, respectively. Data are shown as mean ± SEM. Mann-Whitney tests with Bonferroni correction were used for statistical analysis. P value < 0.05 was considered to be statistically significant. *, P < 0.05; N.S., not significant.
We next focused on differentially expressed genes (DEGs) specifically comparing PS19-TREM2-WT and PS19-TREM2-R47H-induced mice versus their littermate controls (Supplementary Tables 1, 2, 3 and 4). Interestingly, TREM2-WT-induced microglia showed a significant number of DEGs in the DAM subclusters particularly DAM1 cluster (Fig. 5D; Supplementary Table 1). In contrast, transcriptional profiles of TREM2-R47H-induced microglia revealed only a limited number of DEGs, reflecting a reduced response (Fig. 5E; Supplementary Table 2). Pathway analysis of DAM1-specific DEGs in TREM2-WT-induced microglia highlighted terms such as “leukocyte migration”, “cell chemotaxis”, “positive regulation of response to external stimulus”, and “regulation of vasculature development” (Fig. 5F; Supplementary Table 3), emphasizing potential activation driven by TREM2-WT overexpression. In contrast, pathway analysis of DAM1-specific DEGs in TREM2-R47H-induced microglia revealed an opposing regulatory profile, including terms such as “negative regulation of angiogenesis”, “negative regulation of vasculature development”, and “negative regulation of response to external stimuli” (Fig. 5G; Supplementary Table 4). Comparative gene expression analysis in DAM1 further revealed the strong upregulation of microglial activation genes such as Lgals3, Itga4, Spp1, and Flt1 and downregulation of microglial homeostatic genes including P2ry12 in TREM2-WT-induced microglia, with limited changes in TREM2-R47H-induced microglia (Fig. 5H). To further validate these scRNA-seq results, particularly the changes in the DAM microglia signature, we performed Galectin-3 (encoded by Lgals3 gene) immunostaining using a separate cohort of mice, independent of the scRNA-seq analysis. Consistently, we observed a significant increase of Galectin-3 + microglia in the cortex of TREM2-WT-induced, but not TREM2-R47H-induced mice (Fig. 5I-K).
Overall, our data indicate that elevating TREM2-WT expression strongly enhances DAM-associated phenotypes and activates microglia, while TREM2-R47H shows a reduced capacity to do so. However, these microglial changes driven by TREM2-WT lead to only a modest impact on tau pathology and related neurodegeneration in our models.
In this study, we employed a microglia-specific human TREM2 overexpression mouse model to investigate the effects of TREM2-WT and TREM2-R47H on tau pathology, neurodegeneration, and microglial responses. Our findings demonstrate that elevating TREM2-WT expression robustly activates microglia and provides modest benefits for tau pathology, including reductions in soluble p-tau levels and mild preservation of neuronal integrity, but does not affect insoluble p-tau or total tau levels. The reason why only soluble p-tau levels were altered while insoluble tau remained unchanged is unclear. However, since soluble p-tau is considered a potentially toxic early marker of tau pathology and neurodegeneration [44], this suggests that TREM2-mediated microglial activation may have a mild protective effect in the early stages of tau pathogenesis. In contrast, TREM2-R47H expression exhibits a loss-of-function phenotype, with no significant impact on tau pathology, neurodegeneration, or microglial activation.
In tauopathy mouse models such as PS19 mice, microglial activation is one of the earliest changes observed at three months of age, even preceding the onset of tau pathology [39]. However, there is an ongoing debate about whether microglial activation exacerbates or mitigates tau pathology and related neurodegeneration in these models. Studies using different tauopathy mouse models have reported mixed findings when targeting TREM2. Using PS19 mice, some studies suggest that complete deletion of the murine Trem2 gene does not significantly affect tau pathology [26, 31], whereas others indicate that Trem2 haploinsufficiency or knockdown exacerbates tau pathology [30, 45, 46]. Additionally, in a humanized tau mouse model, total loss of Trem2 has been shown to worsen tau pathology [30]. The causes of these discrepancies are not well understood but may stem from differences in tau levels and isoforms expressed in various mouse models, as well as the timing of observations, such as early versus late stages of pathology. These inconsistencies also highlight a critical question: should therapeutic strategies aim to inhibit microglial activation or enhance it to effectively address tau pathology? In our study, although total TREM2 mRNA levels increased approximately twofold - sufficient to drive robust microglial activation - the resulting impact on tau pathology and neurodegeneration in the PS19 background was only modestly beneficial. Therefore, our findings suggest that elevating TREM2 expression to activate microglia leads to mild improvements in tau pathology and neurodegeneration prevention.
AD is a complex chronic disorder involving multiple pathogenic pathways, including amyloid and tau proteinopathy, among others. Evaluating the therapeutic effects of targeting TREM2 in both amyloid and tau contexts is essential. TREM2 has been shown to play a key role in regulating microglial responses to Aβ deposition in many studies using amyloid mouse models [47,48,49,50]. Our previous work with TREM2-inducible mouse models in the 5xFAD background demonstrated that increasing TREM2-WT expression reduces amyloid deposition and neuritic dystrophy during the early stages of amyloid seeding [17]. However, a separate study using 5xFAD mice with AD-tau injections reported that chronic administration of an activating TREM2 antibody increased peri-plaque tau pathology and neuritic dystrophy, without altering Aβ plaque burden [27]. These findings raise important questions about whether elevating TREM2 expression or activating TREM2-mediated microglial functions would be beneficial in the context of both amyloid and tau pathologies, and what the optimal timing for such interventions might be. Further research is needed to clarify these issues.
ScRNA-seq studies have revealed that microglia are highly heterogeneous and identified a distinct DAM cluster in amyloid mouse models. These DAM cells were found to co-localize with Aβ plaques and are suggested to play a neuroprotective role by limiting amyloid deposition and reducing associated neurotoxicity. Studies have shown that deletion of Trem2 leads to a depletion of the DAM phenotype in amyloid mouse models, indicating that TREM2 is a key regulator of DAM activation. Interestingly, DAM-like microglia have also been discovered and found to be enriched in PS19 tauopathy mice [51], however, whether TREM2 regulates DAM activation in tauopathy models remains unclear. Our scRNA-seq findings from PS19 mice confirmed that elevating TREM2-WT expression drives the activation of a DAM-like transcriptional signature, suggesting that TREM2-WT is capable of inducing a DAM-like phenotype in the context of tau pathology. Despite robust DAM activation, the effects on tau pathology and neurodegeneration in PS19 mice were relatively mild. This indicates that while TREM2-WT promotes microglial activation, its ability to mitigate tau-related pathology may be limited in a pure tauopathy model lacking amyloid deposition. This hypothesis is supported by a recent study showing that Trem2 deletion exacerbates tau pathology only when amyloid pathology is present [52], suggesting that TREM2’s protective effects may require co-existing amyloid pathology to fully manifest. Additionally, increasing evidence suggests that Aβ and tau do not act independently but rather interact through shared pathways [53,54,55], leading to a self-reinforcing cycle of neurotoxicity and neuronal damage, which is the key driver of microglial activation [56, 57]. Future studies should focus on evaluating TREM2’s therapeutic potential in the context of Aβ, tau, and neuronal damage.
The TREM2-R47H variant significantly increases the risk of late-onset AD [4, 5]. Studies with amyloid mouse models have shown that TREM2-R47H leads to decreased TREM2 signaling, fewer plaque-associated microglia, reduced expression of TREM2-dependent activation markers [7, 58]. Interestingly, a study using bacterial artificial chromosome (BAC) transgenic mouse mice expressing human TREM2 in the PS19 background revealed that TREM2-R47H conferred a protective effect against tau pathology and neurodegeneration compared to the TREM2 common variant [25]. This protective effect probably attributed to reduced microglial activation, which limits microglia-driven neuroinflammation, synaptic loss and neuronal damage [25]. In our study, we similarly found that elevating TREM2-R47H expression failed to promote microglial activation, further supporting the notion that TREM2-R47H results in a partial loss of TREM2 function. However, unlike the BAC transgenic human TREM2 mice, we did not observe any effect of TREM2-R47H expression on tau pathology or neurodegeneration. This discrepancy may be due to differences in genetic backgrounds between the two models. Notably, while the BAC mice lack the endogenous murine Trem2 gene [25], our animal model retains it, allowing mouse Trem2 to remain functionally active. Another possibility is that although we overexpressed human TREM2-WT or TREM2-R47H in the mouse brain, the major TREM2 interactors, including DAP12, CD33, and APOE [16, 59,60,61], were all of murine origin. These proteins are key regulators of microglial activation, lipid metabolism, and immune signaling, and structural and functional differences between their human and mouse counterparts could impact TREM2 signaling efficiency [62,63,64], potentially dampening the effects of human TREM2-WT and TREM2-R47H in this study.
In summary, using our inducible mouse models, we demonstrate that elevating TREM2-WT levels activates strong microglial DAM signatures, but the impact on tau pathology and neurodegeneration is modest. Further studies are needed to investigate the effects of TREM2 in both amyloid and tau backgrounds to explore its full therapeutic potential for AD treatment.
Count matrices, raw sequencing data, and the metadata associated with each sample identifier are available in the National Center for Biotechnology Information Gene Expression Omnibus under accession number GSE285713.
Not applicable.
This work was supported by NIH grants R01AG66395, RF1AG056130, R01AG087165, and U19AG069701; a BrightFocus Foundation grant; and a grant from Cure Alzheimer’s Fund (to N.Z.).
All animal procedures were approved by the Mayo Clinic Institutional Animal Care and Use Committee (IACUC) and in compliance with the National Institutes of Health (NIH) Guidelines for the Care and Use of Laboratory Animals.
All the authors approved the final version for publication.
G.B. serves as a consultant for SciNeuro Pharmaceuticals and Kisbee Therapeutics. Y.A.M. is a current employee of SciNeuro Pharmaceuticals.
Springer Nature remains neutral with regard to jurisdictional claims in published maps and institutional affiliations.
Open Access This article is licensed under a Creative Commons Attribution-NonCommercial-NoDerivatives 4.0 International License, which permits any non-commercial use, sharing, distribution and reproduction in any medium or format, as long as you give appropriate credit to the original author(s) and the source, provide a link to the Creative Commons licence, and indicate if you modified the licensed material. You do not have permission under this licence to share adapted material derived from this article or parts of it. The images or other third party material in this article are included in the article’s Creative Commons licence, unless indicated otherwise in a credit line to the material. If material is not included in the article’s Creative Commons licence and your intended use is not permitted by statutory regulation or exceeds the permitted use, you will need to obtain permission directly from the copyright holder. To view a copy of this licence, visit http://creativecommons.org/licenses/by-nc-nd/4.0/.
Chen, K., Li, F., Zhang, S. et al. Enhancing TREM2 expression activates microglia and modestly mitigates tau pathology and neurodegeneration. J Neuroinflammation 22, 93 (2025). https://doi.org/10.1186/s12974-025-03420-8
Received:
Accepted:
Published:
DOI: https://doi.org/10.1186/s12974-025-03420-8
