You may also like...
Vitamin D and the Sun: What We Were Taught, What Has Changed, and What to Do Now
The sun still produces vitamin D, but air pollution, ozone changes, skin type, and modern indoor lifestyles mean many pe...
5 Everyday Things You Use That Have Darker Histories Than You Think

Five everyday household items, from alarm clocks to cereal, hide unsettling origin stories shaped by control, exploitati...
Failed African Fintech Startups and the Business Ideas Worth Rebuilding (Part 2)
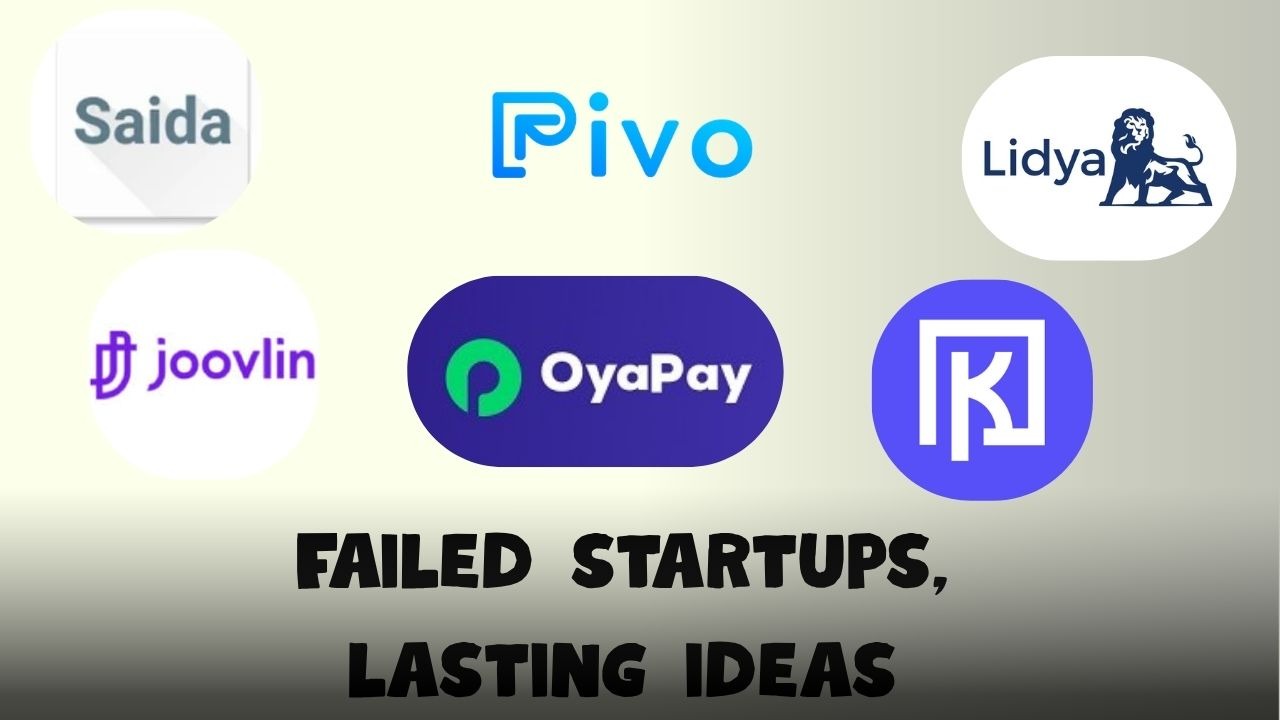
Continuing this deep dive into African fintech failures, this edition examines SME and consumer startups that collapsed ...
Ancient Enhancements: How False Nails and Lashes Began Long Before Modern Beauty

False nails and lashes aren’t modern beauty trends; they trace back thousands of years to ancient Egypt, China, Rome, an...
No More Dollars: What the CBN's Remittance Ban Means for Families Surviving on Money From Abroad

From May 1, 2026, Nigerians can no longer collect remittances in dollars. The CBN says it will stabilise the FX market. ...
Failed African Fintech Startups and the Business Ideas Worth Rebuilding (Part 1)

A deep dive into failed African fintech infrastructure startups, why they shut down, and the ideas behind APIs, wallets,...
K-Dramas That Resonated Strongly with African Audiences

K-dramas may not be set in Africa, but they’ve taken over screens across the continent. With powerful emotions, relatabl...
The Death of the Keypad: A Historical Look at Touchscreen Evolution
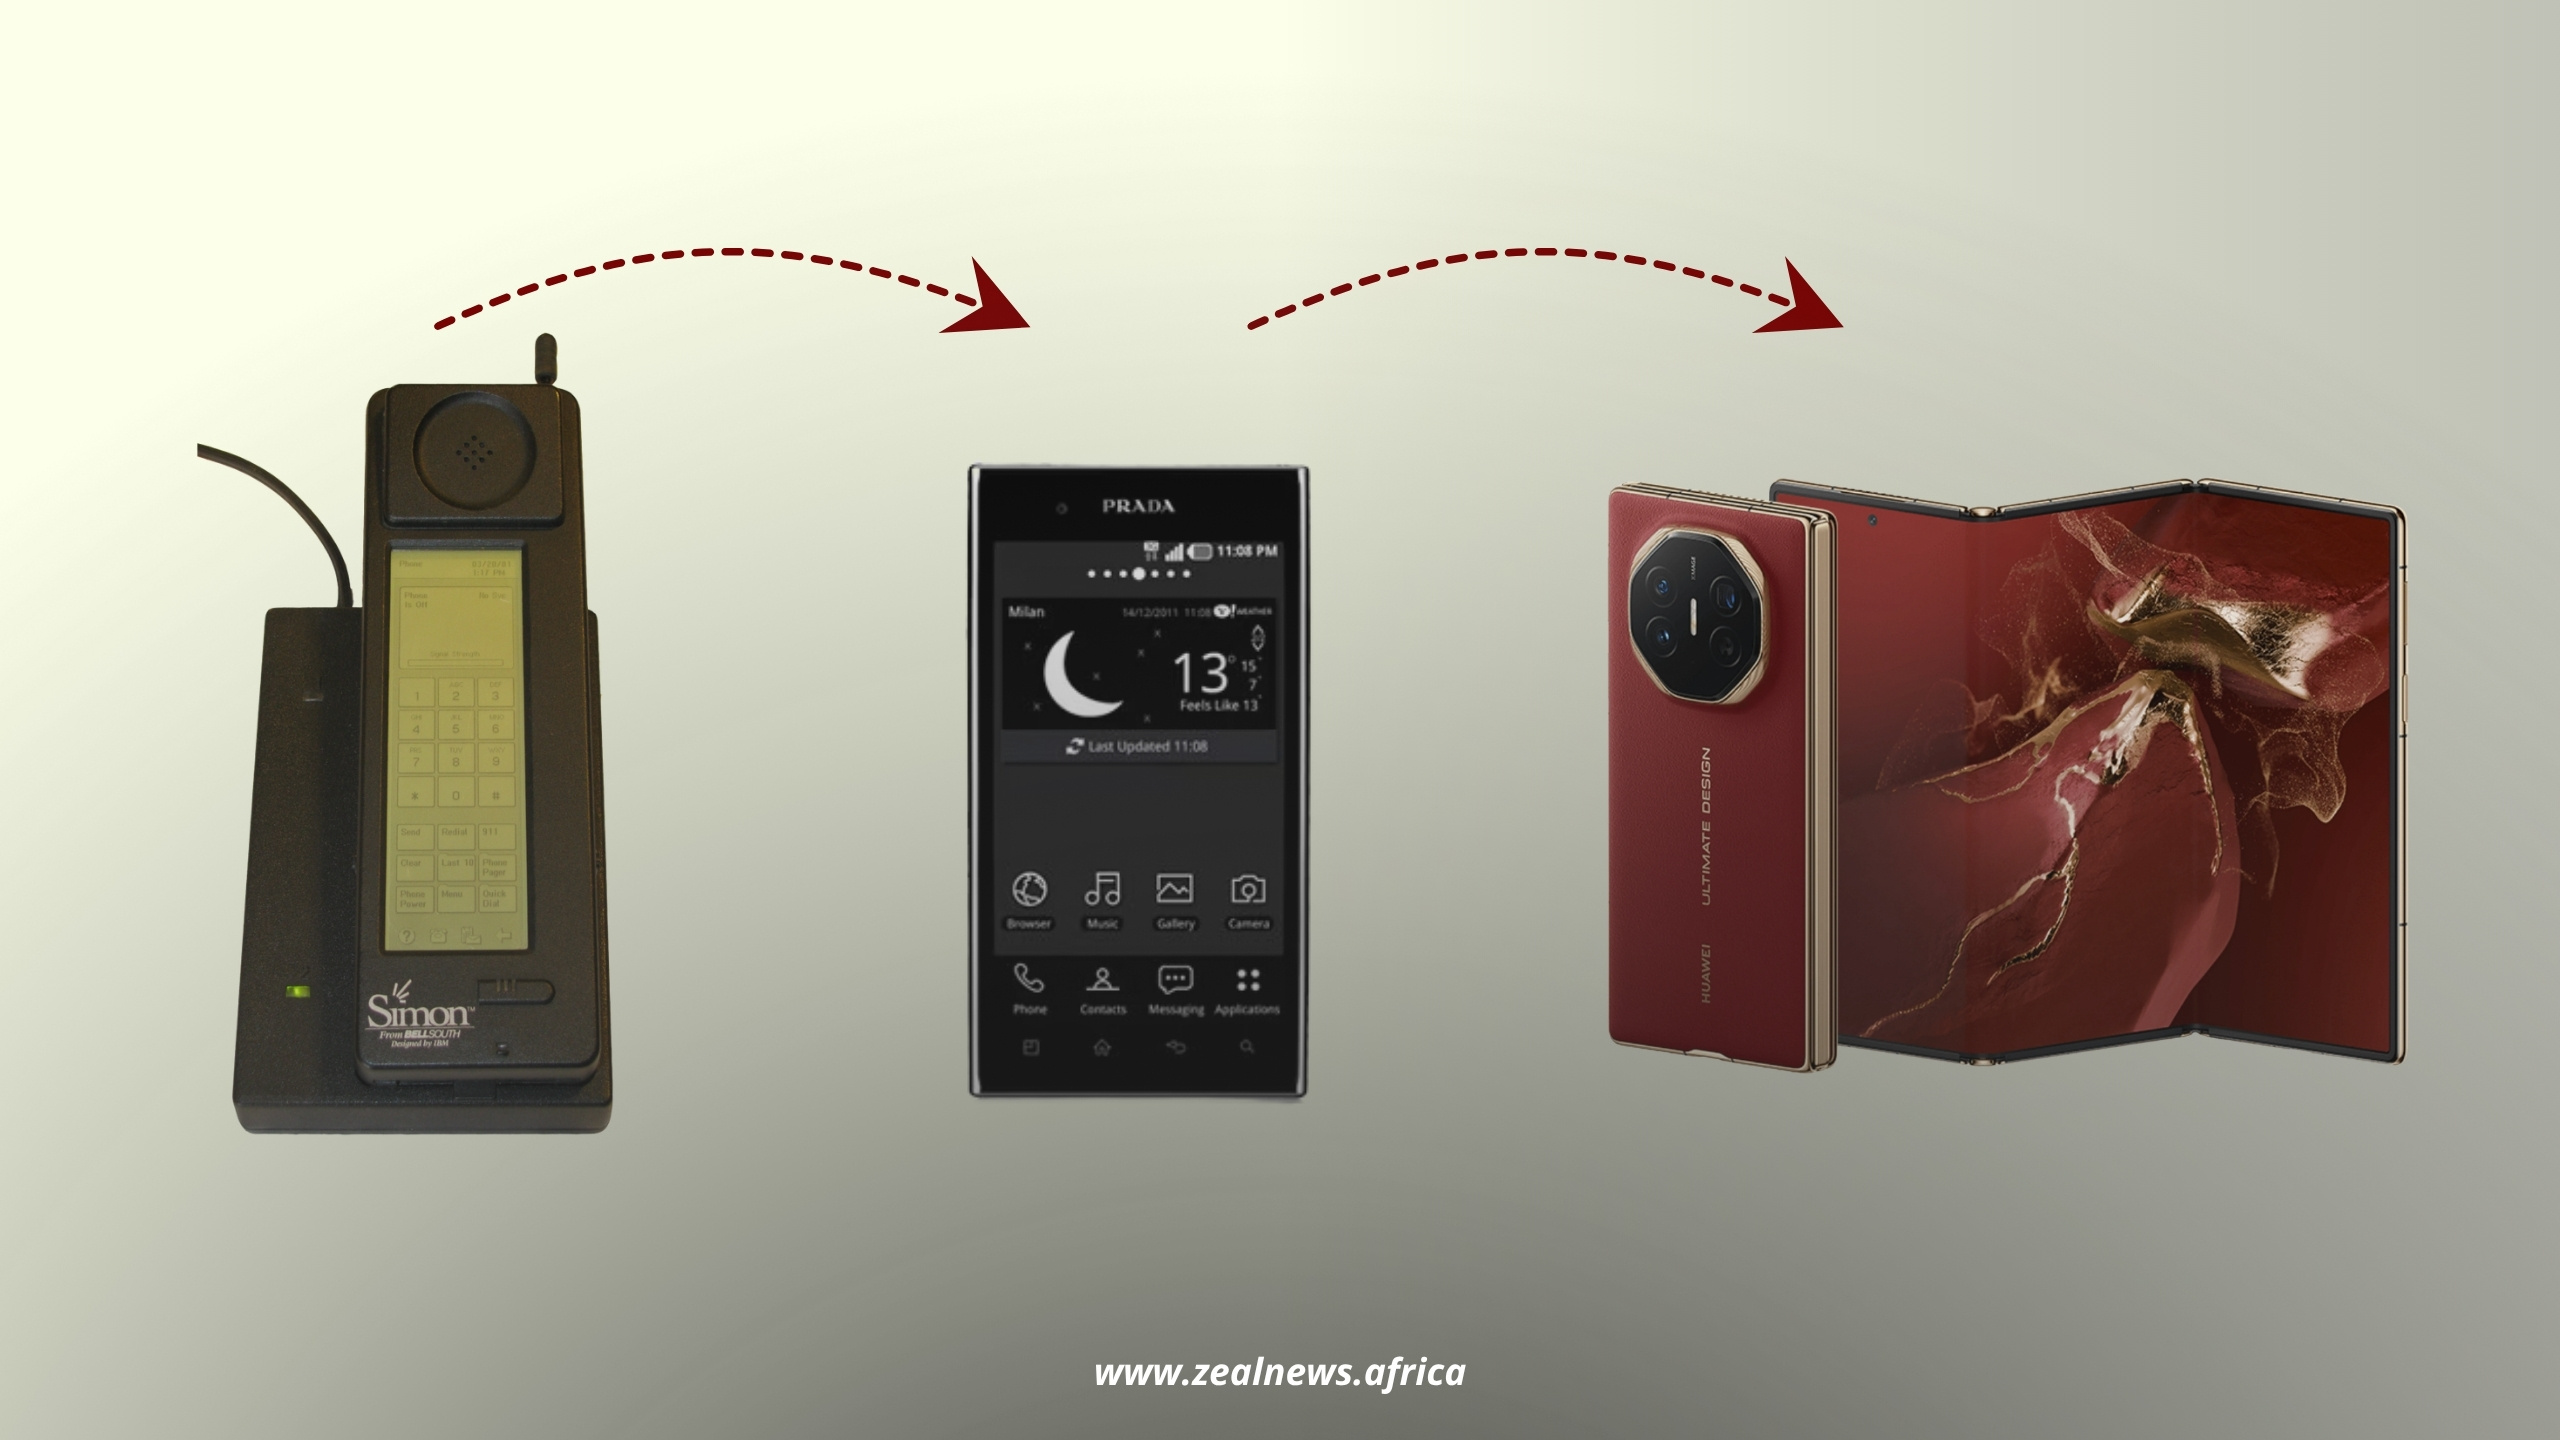
From the IBM Simon to the iPhone, the rise of touchscreen phones tells the story of how glass replaced keypads and resha...