BMC Veterinary Research volume 21, Article number: 355 (2025) Cite this article
Nucleosome levels have been shown to increase in dogs and humans in certain disease states, as a result of cell apoptosis, raising interest in their utility as a biomarker. Detection of nucleosomes in feline blood has yet to be described. Optimal collection tube and processing technique for samples intended for nucleosome analysis varies in the available veterinary and human literature. The aims of this study were to evaluate nucleosome concentration in blood obtained from healthy cats, and describe the impact of collection and processing methods, including tube type, centrifugation protocol, and time to sample processing.
Blood from sixty-four client-owned healthy domestic cats was collected and analyzed. Samples were collected into EDTA, serum separator and sodium citrate tubes. Processing of samples was performed at different timepoints (15, 30, 60, 120 min) and under different centrifugation protocols to ascertain the most reliable sample collection and processing technique. An ELISA with a detection antibody directed at histone 3.1 was utilized to determine nucleosome concentration.
The smaller range of nucleosome concentrations in EDTA samples indicates higher reliability of samples collected into EDTA tubes. Concentrations in samples collected into serum separator and sodium citrate tubes were widely variable in comparison to EDTA tubes. There was no significant difference when comparing H3.1 nucleosome levels from samples collected into serum separator or sodium citrate tubes at the different time points from sample collection to processing. The H3.1 nucleosome levels in the EDTA sample processed at 120-min were significantly higher than those from all other EDTA timepoints. No significant difference in nucleosome concentration was found between centrifugation protocols.
Nucleosomes can be successfully measured in blood obtained from healthy cats. EDTA tubes provided more consistent results compared to sodium citrate and serum separator tubes for evaluation of H3.1 nucleosome levels. The significant increase in nucleosome concentration in EDTA samples that were processed after 120 min justifies sample processing within one hour of collection. Samples can be processed utilizing any of the centrifugation protocols used in this study.
Nucleosomes are structural units of eukaryotic chromosomes that create the basic repeating subunit of chromatin. Each nucleosome is a small fragment of a chromosome and is composed of a segment of DNA wrapped around a histone core, which is comprised of four histone proteins duplicated to form an octamer. Nucleosome functions include protection of DNA from damaging agents, acting as the framework for the deposit of epigenetic signals [1], and repression of certain genes by restricting transcription factor binding.
Nucleosomes are a form of cell-free DNA (cfDNA), which is released during apoptosis or necrosis of many different cell types in normal physiologic function and in disease states [2, 3]. Increased levels of cfDNA and nucleosomes occur in states of inflammation and infection, allowing for the evaluation of these nucleosome levels to aid in the diagnosis and monitoring of various diseases [4, 5]. Neoplastic diseases can be highly variable in their biomarker expression, making development of traditional diagnostics, such as enzyme-linked immunosorbent assays (ELISAs) and polymerase chain reaction (PCR) testing less predictable in their reliability to detect these diseases when aimed at detection of particular biomarkers [5]. The ideal biomarker for any disease process should be sensitive and specific, easy to measure and able to be applied to diagnosis, staging and prognosis [6]. Development of diagnostic tests that detect nucleosomes and their epigenetic profiles is of interest in human and veterinary medicine due to the rapidity, cost-effectiveness and wide diagnostic utility of such assays [5, 7].
The utility of circulating cfDNA and nucleosome levels for diagnostic and prognostic value has been explored in many disease processes, including sepsis in people and dogs, IMHA in dogs, colic in horses and trauma and neoplasia in multiple species. In people with acute, severe pancreatitis, nucleosome levels were found to be predictive of organ dysfunction in patients without evidence of organ dysfunction at initial presentation [8]. Similarly, nucleosome levels were associated with severity of disease in people with COVID-19 [9]. In septic dogs, Letendre and Goggs found that nucleosome concentrations were significantly higher when compared with healthy patients [10]. The relation between nucleosome levels and prognosis was demonstrated by a 2019 paper evaluating dogs following trauma. Higher nucleosome concentrations were found in non-survivors compared to survivors, and elevations correlated with increased illness severity based on the acute trauma triage and acute patient physiology and laboratory evaluation scores [11]. While the detection of plasma nucleosome levels and their utility has been evaluated in dogs, it has yet to be described in cats. There are multiple studies evaluating cfDNA in general and how it relates to feline disease processes such as cardiogenic arterial thromboembolism [12], neoplasia [13] and feline leukemia virus [14], but there are yet to be any studies focusing solely on plasma nucleosome concentrations in cats.
The ability to measure nucleosome concentrations from blood can be impacted by the sampling tube used prior to processing. Two tubes commonly used for blood collection with the intent of processing samples for nucleosome extraction are EDTA and sodium citrate (NaCit). The anticoagulants in these tubes help maintain stability of cfDNA by inhibiting activity of enzymes (DNases) that break down DNA into nucleotides, making the use of these tubes favorable for nucleosome assays [15]. Literature in human medicine on ideal tube type for nucleosome yield varies. One study describing the processing and handling of liquid biopsy samples from healthy human patients found that nucleosome extraction was highest from NaCit samples [15], whereas another found that yield was similar from EDTA and NaCit samples when processed on the same day of collection [9]. In dogs meeting systemic inflammatory response syndrome criteria, Goggs et al. showed that EDTA and NaCit tubes could be used without a statistically significant difference in measured nucleosome concentrations, with equivocal performance to a tube specifically designed with a stabilizing agent to prevent cell lysis [16]. In this same study, NaCit plasma and EDTA plasma provided the best correlation between nucleosome levels in samples.
There is variation in the human and veterinary literature regarding sample handling protocols including centrifugation speed and time, as well as optimal time between sample collection and processing. Baseline nucleosome concentrations in blood can be low, necessitating appropriate centrifugation technique for optimal measurement [17]. Additionally, delayed time to sample processing can elevate nucleosome levels due to cell lysis and nuclease activity [4, 17]. The ideal processing technique will optimize plasma nucleosome detection while preserving the ability of the diagnostic test to produce reliable results.
The aims of this study were to evaluate nucleosome concentrations from blood obtained from healthy cats, and describe the impact of tube selection, centrifugation protocol and time to sample processing on nucleosome concentration. The data generated by this study will be used to establish the standard sample processing guidelines to be used in future investigations validating the use of plasma nucleosome levels to diagnose and monitor various feline disease states. Future research may be needed to determine the ideal timing of feline diagnostics that are centered on cfDNA quantification. It was hypothesized that sample processing for nucleosome quantification would be similar to canines, and that samples collected into EDTA or NaCit tubes processed within 60 min at a centrifuge speed of 1600 g for 10 min would yield consistent results.
Sixty-four healthy cats were recruited for 9 separate blood draws at 5 veterinary referral hospitals. Animal care and use committee approval was obtained at all participating sites on the study protocol and client informed consent was obtained for each cat enrolled. Cats needed to be deemed healthy, over 1 year of age, greater than 2.5 kg, fasted for at least 8 h prior to presentation and not pregnant. Cats were determined to be healthy based on physical examination and bloodwork (CBC, biochemistry). Manual platelet counts were performed for any cat whose CBC demonstrated low platelets to determine the presence of clumping. Cats receiving any medication other than flea/tick preventative or joint supplements were excluded. Pre-medication with oral gabapentin (10–20 mg/kg) or intramuscular butorphanol (0.2 mg/kg) prior to the first blood draw was permitted if needed.
Blood samples were collected from peripherally inserted long peripheral venous catheters (22 g, 8.0″ intra-catheters, MWI Animal Health, Boise, ID) or via direct venipuncture of cephalic, medial saphenous or jugular veins. Eighteen cats were enrolled for the first variable, determination of appropriate collection tube, 6 mL blood was drawn and divided between 3 serum separator tubes (SST), a single 2 mL K-2 EDTA tube and a single 2 mL NaCit tube. The EDTA and NaCit tubes were mixed by gently inverting the tubes 2–3 times. The blood from the EDTA and NaCit tubes were then divided into 3 equal portions and placed in clean (no additive) tubes. For each collection tube type the three tubes were labeled 1, 2 and 3. Fifteen minutes after collection, tubes labeled 1 for each collection tube type were centrifuged at 3000 g for 10 min. Tubes labeled 2 and 3 were centrifuged at the same speed and duration but at 30- and 60-min post blood draw, respectively.
Following an interim analysis, a fourth time point was added to the EDTA collection tube cohort. Twenty-two new cats fitting the criteria listed above had a single blood draw of 2 mL collected via direct venipuncture from a peripheral or jugular vein that was centrifuged at 3000 g for 10 min 120 min after blood collection. Within 15 min of completing centrifugation 500 μL aliquots of the isolated plasma were carefully pipetted into corresponding pre-labeled 2 mL cryovials for all samples. Samples were immediately frozen at −80 °C and were later batch shipped on dry ice to the laboratory performing the nucleosome analysis.
To assess variable centrifugation speed and duration, 3 mL of blood was collected from 43 cats (19 cats from the previous variable and 24 new cats) from peripherally inserted central venous catheters (22 g, 8.0″ intra-catheters, MWI Animal Health, Boise, ID) or via direct venipuncture of cephalic or jugular veins. In 19 cats, the blood was placed into K-2 EDTA tubes and in 24 cats the blood was placed into NaCit tubes. The blood was divided into 3 equal aliquots and each aliquot was labeled A, B or C. Aliquots A were centrifuged within 15 min of blood collection at 3000 g for 10 min. Aliquots B were centrifuged within 15 min of blood collection at 1600 g for 10 min. Aliquots C were centrifuged within 15 min of blood collection at 1600 g for 20 min. Within 15 min of completing centrifugation, 500 μL aliquots of the isolated plasma were carefully pipetted out into corresponding pre-labeled 2 mL cryovials for all samples. Samples were immediately frozen at −80 °C and were later batch shipped on dry ice to the laboratory performing the nucleosome analysis.
All nucleosome concentrations were measured using the Nu.Q® assay (Belgium Volition, SRL, Isnes, Belgium), an ELISA with a detection antibody directed at histone 3.1 (H3.1) and a nucleosome specific capture antibody. Assays were performed in accordance with the manufacturer’s instructions. All samples were thawed and allowed to come to room temperature for a minimum of 30 min prior to analysis. Briefly, a standard curve was generated using the positive control stock (recombinant H3.1 nucleosomes) provided. Samples were vortexed and centrifuged at 14,000 × g for 2 min at 4 °C. Nucleosomes were bound by the capture antibody and plates were washed 3 times using a 1 × wash buffer. Twenty microliters of each sample was pipetted, in duplicate, into wells on the plate. 80 µL of the assay buffer was added to each well. The plate was covered with sealing film and incubated on an orbital shaker for 2.5 h at 700 rpm. Plates were emptied and washed 3 times using a 1 × washing buffer. Next, 100 µL of detection antibody was added to each well. The plate was resealed and incubated for an additional 1.5 h on the orbital shaker. Plates were washed as previously described. Following wash, 100µL of colorimetric substrate solution was applied and the plates were incubated in the dark for 20 min at 700 rpm. A stop solution (100µL) was added to the wells and the plates were read on a plate reader at 450 nm (BioTek Synergy H1 plate reader, BioTek Instruments, Winooski, VT). The standard curve was fitted to a 4-parameter logistic curve using statistical software (Graphpad Software, version 10, San Diego, CA).
Samples from each collection tube type were analyzed using a Kruskal–Wallis Test with a Dunn’s multiple comparison test. Descriptive statistics were also generated for each condition. Samples for each centrifugation variable were analyzed together by collection tube type using a Kruskal–Wallis test with a Dunn’s multiple comparison test. Data were analyzed using statistical software (Graphpad Software, version 10, San Diego, CA).
A total of 64 healthy cats met the inclusion criteria. The median age of study participants was 6.5 years (range: 2–11). Cats from 5 institutions participated in different variables. No cat participated in every variable. Of the included patients, the number of samples analyzed varied between time points and tube types. Samples from SST were analyzed in the fewest number of cats (n = 7).
Nucleosome concentration from 7 feline SST samples ranged widely between patients (Fig. 1). H3.1 plasma nucleosome levels from SST centrifuged at 15-, 30- and 60-min post-collection ranged from 16.1–486.9 ng/mL (SD: 179.4), 7.2–611.0 ng/dL (SD: 250.8), and 14.3–894.2 ng/mL (SD: 383.5), respectively. Due to the wide range of serum concentrations at each time point, there was no significant difference when comparing H3.1 nucleosome levels from the serum samples at different processing times.
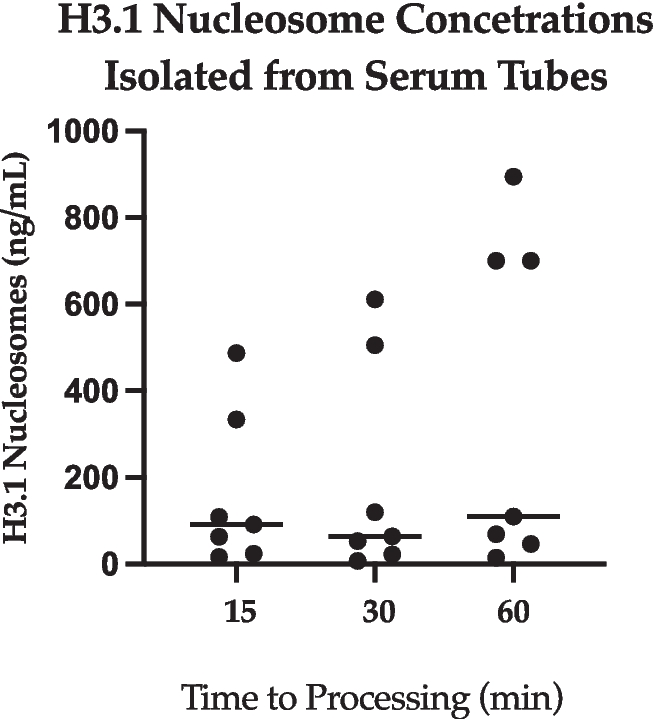
Serum (all time points). A dot plot showing H3.1 nucleosome concentrations extracted from SST at all time points. The y axis represents extracted nucleosomes (ng/mL) and the x axis represents time elapsed after collection (min), prior to processing of the sample
Nucleosome concentrations from EDTA and NaCit samples were lower overall in comparison to SST. H3.1 nucleosome levels following centrifugation of NaCit tubes (n = 14) after 15-, 30- and 60-min post-collection (Fig. 2) ranged from 0.3–24.4 ng/mL (SD: 8.4), 0.0–72.7 ng/mL (SD: 20.9), and 0.0–281.7 (SD: 73.6), respectively. There was no significant difference when comparing H3.1 nucleosomes concentrations from NaCit samples at different processing times. Data from an additional timepoint was evaluated for EDTA samples due to smaller variation in H3.1 nucleosome levels at the original timepoints. Number of samples evaluated varied between EDTA samples at all time points (range: 17–20). H3.1 nucleosome levels following centrifugation of EDTA tubes after 15-, 30-, 60- and 120-min post-collection (Fig. 3) ranged from 0.0–13.7 ng/mL (SD: 3.7), 0.0–4.7 ng/mL (SD: 5.49), 0.0–17.5 ng/mL (SD: 5.3), and 2.2–23.9 ng/mL (SD: 5.9). The H3.1 nucleosome levels in the 120-min EDTA sample were significantly higher than those from all other EDTA timepoints.
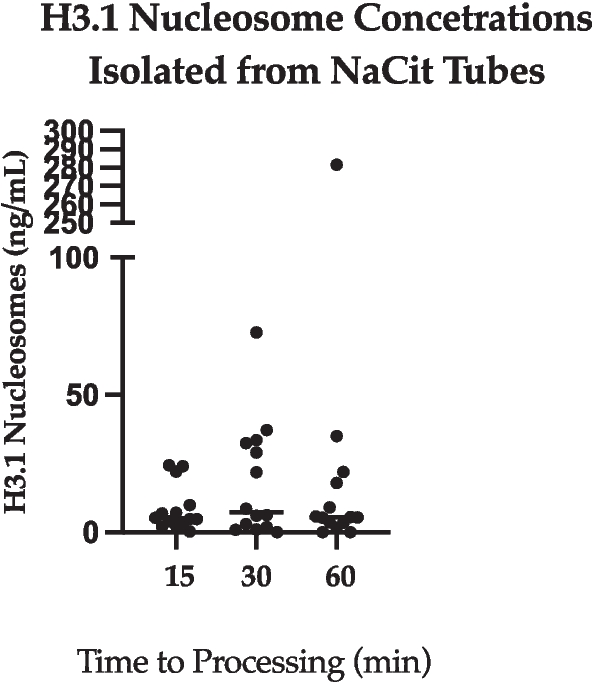
NaCit (all time points). A dot plot showing H3.1 nucleosome concentrations extracted from NaCit tubes at all time points. The y axis represents extracted nucleosomes (ng/mL) and the x axis represents time elapsed after collection (min), prior to processing of the sample
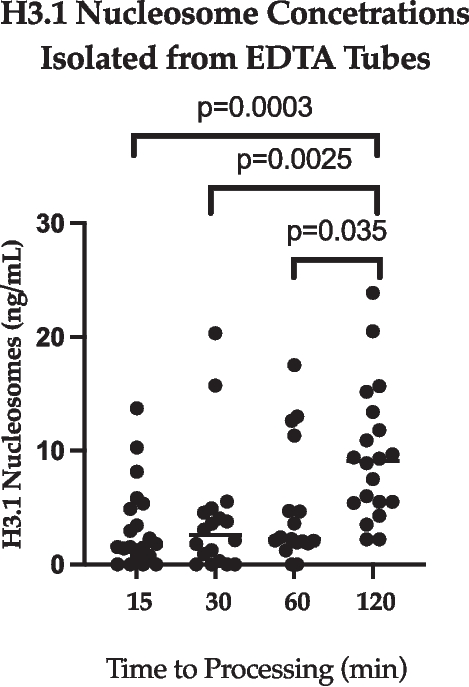
EDTA (all time points). A dot plot showing H3.1 nucleosome concentrations from samples collected into EDTA tubes at all time points. The y axis represents sample nucleosome concentration (ng/mL) and the x axis represents time elapsed after collection (min), prior to processing of the sample. Statistical significance of the variation in H3.1 nucleosome levels between time points is represented by the p values on this figure
Three different centrifugation protocols were compared between NaCit and EDTA tube samples. Due to the large variation in serum concentrations of nucleosomes isolated from SST in the tube type variable portion of the study, evaluation of SST samples was excluded from the centrifugation variable analysis. Tubes were processed in the centrifuge at 3000 g for 10 min, 1600 g for 10 min, or 1600 g for 20 min. Nucleosome levels in samples collected into EDTA tubes have less variability and a smaller standard deviation when compared with NaCit, regardless of centrifugation protocol. The largest range of nucleosome concentrations in NaCit and EDTA samples were tubes spun at 1600 g for 10 min (NaCit: 0–284.5 ng/mL (SD: 56.9); EDTA (0–23.4 ng/mL (SD: 5.2)). Nucleosome concentrations were lowest when samples were centrifuged at 3000 g for 10 min (NaCit 179.9 ng/dL; EDTA 16.6 ng/dL). These findings are represented in Figs. 4 and 5. There was no significant difference between groups or between protocols for either NaCit or EDTA tubes regarding centrifugation speed and time analyzed in this study.
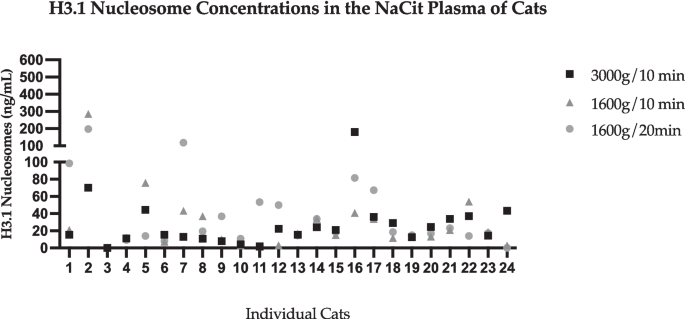
H3.1 nucleosome concentrations extracted from samples collected into NaCit tubes at various centrifuge variables. The y axis represents extracted nucleosomes (ng/mL). Numbers on the x axis represent individual cats. Plots on this figure represent the concentration of nucleosomes extracted from individual cat samples as a result of 3 different centrifugation protocols
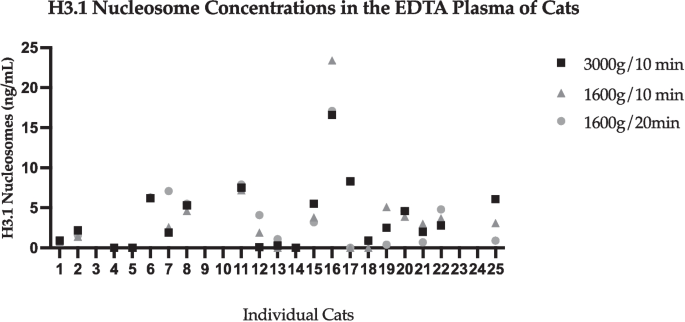
H3.1 nucleosome concentrations from samples collected into EDTA tubes at various centrifuge variables. The y axis represents extracted nucleosomes (ng/mL). Numbers on the x axis represent individual cats. Plots on this figure represent the concentration of nucleosomes extracted from individual cat samples as a result of 3 different centrifugation protocols
Contrary to existing literature in veterinary and human medicine, our study suggests that EDTA tubes are superior to NaCit tubes for collection of feline blood samples for evaluation of H3.1 nucleosome levels. The concentrations from EDTA samples demonstrated less interpatient variability across conditions when compared to those from both NaCit and SST. Canine and human studies show minimal variation in plasma nucleosome concentrations when comparing samples from EDTA and NaCit tubes [14, 15], but there are no previous feline studies that evaluate ideal tube type for quantification of H3.1 nucleosomes from blood. The overall increased stability in plasma H3.1 nucleosome concentrations from EDTA tubes in comparison to NaCit and SST in this study is not entirely understood based on the literature available regarding tube types. Endogenous DNases are less active in human plasma samples that contain EDTA and NaCit, indicating that the presence of either of these anticoagulants would minimize breakdown of DNA in the preanalytical time period [4, 18]. EDTA tubes were considered more desirable in a study evaluating tube types in dogs, but in this study, the overall plasma H3.1 nucleosome concentrations from EDTA tubes were slightly higher and more variable, in comparison to NaCit tubes, though this was not statistically significant [4]. This is in contrast to the results of our study. Another canine study showed no difference between plasma nucleosome concentrations between these two tube types [16]. The overall nucleosome concentrations in healthy cats is also lower compared to healthy dogs [4, 13], Implying that there is a feline-specific reason for the difference found in our study. The reason for this difference has not been ascertained, although it could be hypothesized that species differences in plasma composition, protease or nuclease activity, or leukocyte lysis rates could contribute to more rapid degradation or altered release of nucleosomes in certain tube types.
Extension of the EDTA processing timepoints to 120 min post-collection demonstrated a statistically significant increase in H3.1 nucleosome concentrations in comparison to earlier timepoints. This supports the recommendation of a previous study to process samples within 60 min of collection [4]. Nucleosomes are released as a result of cell apoptosis or necrosis and resulting DNA degradation and release [2, 3], therefore concentrations would be expected to increase with time in a sample that is awaiting processing, with cell death occurring as sources of energy and nutrients are depleted.
No significant difference was found between centrifugation protocols, which is in agreement with prior literature. The standard protocol for centrifugation of blood in human medicine is a speed of 3000 g for 10 min, although techniques across the human and veterinary literature vary. Multiple human and canine papers regarding cell-free DNA and nucleosome quantification utilize a double-centrifugation technique, especially after freezing of the plasma. The protocols utilized in this study varied in speed and time and were intended to mimic the inherent variety in types of centrifuges that different veterinary hospitals utilize.
As with many veterinary studies, the main limitation of this study was a small sample size, which may have affected the overall significance of data when comparing outcomes within and between groups. Another potential limitation to this study is that it was a multicenter study using cats of different age, gender and breed for different variables. Considering what we know about physiology, as well as about cell-free DNA, it is reasonable to assume that there may be changes in nucleosome concentrations with age, in animals of different body conditions, and/or as a result of stress. Additionally, cats could have underlying comorbidities that were not identified by the intake screening. Based on the lack of statistically significant variation in almost all outcomes within groups, these variables are considered less likely to have a strong impact on clinically relevant nucleosome levels. Additionally, the use of a larger number of cats across a geographically diverse area may better reflect the true feline patient population and lend credence to the utility of EDTA as a consistently stable sample type for detecting cfDNA in cats.
Overall, this study is the first to provide a technique for successful quantification of H3.1 nucleosomes from feline blood. This allows for future studies to determine clinical relevance of nucleosome levels in cats and how they may be altered in illness or contribute to disease prognostication as a biomarker. Additionally, it supports the use of EDTA tubes when collecting samples for nucleosome testing in cats. Further research is likely indicated to validate this finding, given the contrast to findings in human and canine literature.
Literature is limited regarding circulating nucleosomes and cell-free DNA in feline blood. This study confirms that H3.1 nucleosomes can be successfully quantified from blood obtained from healthy cats, as well as presents data regarding optimal collection and processing protocol. Nucleosome concentrations are affected by tube selection and can be falsely elevated by a delay of sample processing beyond 60 min. EDTA tubes are superior to NaCit and SST for reliability of nucleosome levels, due to a lack of interpatient variability when compared to the other two. The centrifugation protocols assessed in this study did not affect nucleosome concentrations. Future prospective studies should be considered to determine the clinical utility of nucleosome concentrations as a biomarker in feline illness for diagnostic and/or prognostic purposes.
The datasets used and/or analysed during the current study are available from the corresponding author on reasonable request.
- cfDNA:
-
Cell-free DNA
- EDTA:
-
Ethylenediaminetetraacetic acid
- ELISA:
-
Enzyme-linked immunosorbent assay
- NaCit:
-
Sodium citrate
- PCR:
-
Polymerase chain reaction
- SST:
-
Serum separator tube
The authors wish to thank the doctors and support staff at the additional participating locations (Midwestern University, Nashville Veterinary Specialists, and Mission Veterinary Emergency & Specialty) for their assistance in collecting and processing samples.
Not applicable.
Funding for materials, sample collection and processing and Volition employee salaries was provided by Belgian Volition, SRL or another subsidiary of VolitionRX Limited as detailed above.
All experimental procedures were conducted following the relevant guidelines and regulations for the experimental research on animals. Study design was reviewed and approved by each institution’s respective IACUC. All cat owners signed a written consent form and were aware that samples were being collected for research purposes.
Not applicable.
Volition Veterinary Diagnostics Development LLC is a joint venture between Belgian Volition SRL and Texas A&M University. Volition America Inc, Volition Diagnostics UK Ltd, Volition Veterinary Diagnostics Development LLC and Belgian Volition SRL are subsidiaries of VolitionRx Ltd. Belgian Volition SRL has patents covering Nu.Q® technology and are developers of Nu.Q® assays. Funding for materials and some author salaries was provided by Belgian Volition SRL. HWR, acting as the Chief Medical Officer of Volition Veterinary Diagnostics Development LLC, is a part-time employee of Volition America Inc, and holds stock, stock options and Restricted Stock Units of VolitionRx Ltd.MB is an employee of Belgian Volition SRL. JAH is a paid consultant of Volition Veterinary Diagnostics Development LLC and holds stock and Restricted Stock Units of VolitionRx Ltd. Other authors have no conflicts of interest to declare.
Springer Nature remains neutral with regard to jurisdictional claims in published maps and institutional affiliations.
Open Access This article is licensed under a Creative Commons Attribution-NonCommercial-NoDerivatives 4.0 International License, which permits any non-commercial use, sharing, distribution and reproduction in any medium or format, as long as you give appropriate credit to the original author(s) and the source, provide a link to the Creative Commons licence, and indicate if you modified the licensed material. You do not have permission under this licence to share adapted material derived from this article or parts of it. The images or other third party material in this article are included in the article’s Creative Commons licence, unless indicated otherwise in a credit line to the material. If material is not included in the article’s Creative Commons licence and your intended use is not permitted by statutory regulation or exceeds the permitted use, you will need to obtain permission directly from the copyright holder. To view a copy of this licence, visit http://creativecommons.org/licenses/by-nc-nd/4.0/.

Westerback, E., Wilson-Robles, H., Bougoussa, M. et al. Evaluation of plasma nucleosome concentrations and the effect of pre-analytical variables in healthy cats. BMC Vet Res 21, 355 (2025). https://doi.org/10.1186/s12917-025-04785-x
Received:
Accepted:
Published:
DOI: https://doi.org/10.1186/s12917-025-04785-x