For the past few years, we’ve routinely used CDC national wastewater levels to report “The Weather.” Our website uses CDC data to generate the national wastewater levels map. We have sometimes reported WastewaterSCAN (WWS) data or encouraged folks to use the WWS dashboard to look for local data if the CDC data doesn’t include anything local to them. Usually, WWS and CDC national assessments are more or less in alignment. This week, though, readers might have noticed a temporary (major) discrepancy: for at least one day, WWS designated COVID wastewater a category of “High” while CDC was still showing the level as “very low.” Since then, the values have come into more of an agreement: WWS now calls the category “medium” and CDC calling the level “low.”
We took a deep dive to see what was going on. Unlike CDC’s updates which are every other week, WWS updates more continuously. Sometimes, blips and bumps in the data turn out to be artifacts, and they eventually get corrected or settle out. This seems to have been the case this week: one site in Idaho was temporarily showing very high levels, pulling the average up. Now, this artifactually high output from one site seems to have disappeared. We will continue to keep an eye on both sites for any sign of a summer surge. For now, neither wastewater surveillance system seems to be detecting one.
The CDC says that current national levels are “Low,” with the South having the highest levels. As mentioned above, remember that even if your state’s overall levels look low, certain areas within it may have higher levels. You can check your state here to see more detailed local data.
. Text above the map reads: “CDC data, COVID Wastewater Map” At the bottom, the text reads “People’s CDC. Source: CDC.”")
CDC and WastewaterSCAN are generally noting the same general, slight upward trend.

Graphic Source: WastewaterSCAN (Click on “view chart details”)

We also want to highlight a new data source on the block: lung.fish is a new collection of dashboards put together by a consortium of academic research laboratories and public health organizations. They have been collecting pathogen genomic information and sharing it transparently in hopes that it will allow scientists to identify pathogen outbreaks. Though there are not a ton of sites reporting to them just yet, they do have information about a whole lot of pathogens.
As always, we encourage you to find your most local data in order to determine best what is happening near you. And, we still encourage everyone to mask up, especially indoors!
Thanks for reading! This post is public so feel free to share it.
The CDC is still posting data about Emergency Room visits. More specifically, they report the proportion of ED visits in which COVID is diagnosed. We’ve seen a gradual increase in this number since about mid-May, but no signal of a summer surge just yet.
 from 0 to 1.4 percent. The X axis represents weeks from November 2, 2024 to July 5, 2025. The peak is between December and January of 2025 with COVID representing over 1.3 percent of ED visits. There is a gradual trend downward until May of this year, dipping to less than 0.4 percent and then gradually rising to over 0.4 percent of ED visits for COVID as of July.Text above the graph reads “Emergency Department Visits”. Text at the bottom reads “People’s CDC. Source: CDC.”")
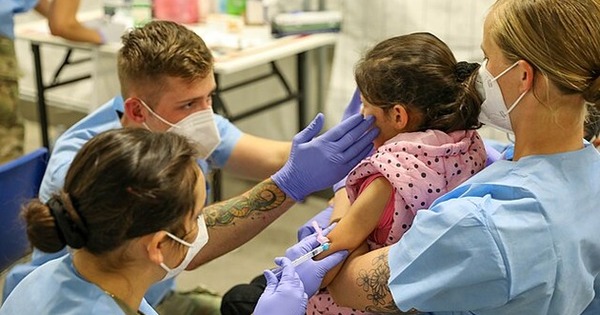
States’ public health departments are vowing to convene their own vaccine advisory committees in light of RFK’s corruption of ACIP. Read, for example, the announcement from Dr. Sameer Vohra, the Director of Illinois Department of Health. Massachusetts, meanwhile, is working to disentangle its vaccine policies from federal recommendations in order to maintain access for its residents.
The NYC Department of health has announced that it plans to close its last COVID/Flu/RSV testing center on July 18. But activists including ACT UP and local mask bloc organizers are refusing to stay silent, demanding that the NYC DOH not only keep this site open, but also expand testing to each of the city’s free clinics. Last week on Wednesday, they took their protest to the lobby of the Health Department offices. Expanding and strengthening publicly provided care is an essential strategy for opposing federal cuts to Medicare and Medicaid. We celebrate these activists’ efforts, recognizing that same-day PCRs are important tools in preventing asymptomatic and pre-symptomatic COVID spread, in accessing Long COVID care or treatment, and in removing barriers to Paxolovid treatment.
If you want to join the resistance to this closure, call and write your city council person (especially if its Chi Osse (@cmchiosse) and call and write Lynn Schulman (@lynn4nyc) the head of the city council’s committee on health to tell them HANDS OFF OUR FREE CLINICS.
Progressive Labor Party members and friends in Maryland launched a campaign against DC’s transit authority for recruiting Customs and Border Patrol (CBP)/ICE agents. The DC Metro system posted signs on its buses and trains calling for people to join the CBP.

CBP agents patrol US borders to detain and deport immigrants. They abduct people who are fleeing their homes in Haiti, Africa, and Latin America where extreme poverty and violence, generated by US imperialism, have driven them out. The Trump Administration is rounding up and intimidating professors, students, healthcare workers, and pro-Palestinian advocates. Detentions and deportations prevent families from working, from seeking healthcare, and from accessing education. They create intense, health-impacting stress.
So, folks in Maryland collected postcards and petition signatures demanding an end to these recruitment images on public transit. They visited bus barns to talk with bus operators. The Metro union also expressed outrage and support for the protest efforts. Now, organizers are continuing their efforts and joining with the Metro union to demand free fares.
You, too, can join anti-ICE/CBP efforts. Join Rapid Response teams in your community. Get trained to confront ICE when they come for your neighbors. Meanwhile, join mutual aid efforts to support immigrant families with food and medical care. Healthcare workers can organize clinics and hospitals to protect their patients. Teachers can shelter their students from raids.
Notes: 1) The numbers in this report were current as of 7/11/2025. 2) Check out the links throughout & see our website for more at https://peoplescdc.org. 3) Subscribe to our newsletter: People’s CDC | Substack.