You may also like...
Transfer Frenzy: Chelsea & Newcastle Eyeing Star Striker Darwin Núñez as Free Agent!

The latest football transfer market is abuzz with activity, highlighted by free agent Darwin Núñez's potential Premier L...
Fury Erupts: Brentford Boss & Captain Blast Referee's Decisions in Crushing City Loss!
Brentford's coach Keith Andrews and captain Nathan Collins voiced strong criticism after a controversial penalty decisio...
Cannes Shockwave: Werner Herzog Snubs Festival After Competition Slot Denial!

Werner Herzog's film "Bucking Fastard" will not premiere at the Cannes Film Festival, as the filmmakers declined an offi...
Box Office Battle: Mortal Kombat II & Devil Wears Prada 2 Clash for Top Spot!

The box office saw a new champion as "Mortal Kombat II" debuted atop the Friday charts, outpacing last week's leader, "T...
Charli XCX Unleashes New B-Side Track on 'Rock Music' Vinyl

Charli XCX's new B-side track, "I Keep On Thinking Bout You Every Single Day and Night," explores themes of obsession an...
6ix9ine's Shocking Gender Reveal Comments Ignite Fan Outrage

Rapper 6ix9ine stirred controversy at his girlfriend Aliday Alter's gender reveal party, claiming he would terminate the...
Ancient Icons Revealed: Meet the Muses, Goddesses of Inspiration and the Arts
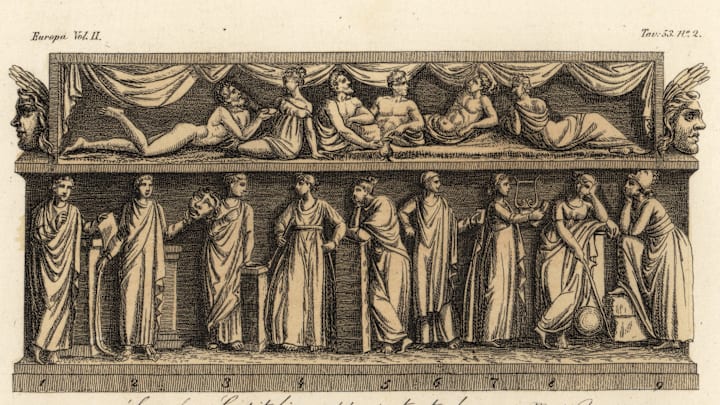
Explore the ancient Greek Muses, daughters of Zeus and Mnemosyne, who embody inspiration in art, education, and myth. Th...
US Political Shakeup: Trump's Low Ratings and Republican Chaos - Can Democrats Seize the Senate?

A profound shift is underway in the American political landscape, with evidence suggesting the coalition that elected Do...