BMC Geriatrics volume 25, Article number: 230 (2025) Cite this article
A poor prognosis within 1 year of discharge is important when making decisions affecting postoperative geriatric inpatients. Comprehensive geriatric assessment (CGA) plays an important role in guiding holistic assessment-based interventions. However, current prognostic models derived from CGA and clinical data are limited and have unsatisfactory performance. We aimed to develop an accurate 1-year mortality prediction model for patients discharged from the geriatric ward using CGA and clinical data.
This longitudinal cohort study analysed data from 816 consecutively assessed geriatric patients between January 1, 2018 and December 31, 2019. Models were constructed using Cox proportional hazards regression and their validity was assessed by analysing discrimination, calibration, and decision curves. The robustness of the model was determined using sensitivity analysis. A nomogram was developed to predict the 1-year probability of mortality, and the model was validated using C-statistics, Brier scores, and calibration curves.
During 644 patient-years of follow-up, 57 (11·7%) patients died. Clinical variables included in the final prediction model were activities of daily living, serum albumin level, Charlson Comorbidity Index, FRAIL scale, and Mini-Nutrition Assessment-Short Form scores. A C-statistic value of 0·911, a Brier score of 0·058, and a calibration curve validated the model.
Our risk stratification model can accurately predict prospective mortality risk among patients discharged from the geriatric ward. The functionality of this tool facilitates objective palliative care.
The ageing population poses a considerable healthcare challenge to societies. Well-informed medical decisions are crucial for physicians to minimise suffering and enhance the quality of life (QOL) of older patients. Prognostic information plays a critical role in this decision-making process [1], especially when patients face a period of high mortality risk or limited life expectancy. This requires discussion about end-of-life care options, such as hospice palliative care. Establishing a reliable 1-year mortality prediction model for short-term adverse prognoses in older patients is vital. Hospitalisation often represents a significant health transition for older adults, and reassessment of care goals is routinely conducted at this point within geriatric departments. Thus, a 1-year mortality prediction model for patients admitted to geriatric wards is meaningful for patients and physicians.
Numerous mortality prediction models target specific diseases [2] or are designed for specific medical settings [3]. However, other models that are not tailored to specific diseases incorporate a multitude of variables that are primarily disease-focused [4]. Patients in geriatric wards have a high prevalence of several chronic conditions and diminished functional capacity. Therefore, disease-focused models with numerous variables do not adequately capture the holistic condition of these patients. Consequently, these models have not been widely adopted for routine clinical geriatric care.
A multidimensional and interdisciplinary comprehensive geriatric assessment (CGA) involves assessing the medical, psychological, and functional capabilities of older adults [5]. The CGA has emerged as a key approach for managing patients in geriatric wards. Although the CGA plays a key role in guiding holistic assessment-based intervention [6], prognostic models derived from CGA assessments remain limited. The multidimensional prognostic index (MPI) [7] and geriatric prognostic index (GPI) [8] categorise older patients based on their risk of mortality based on data obtained from the CGA. Notably, the MPI considers indicators from the CGA alone, whereas the GPI also includes age and sex. Nonetheless, the significance of including biochemical markers and functional indicators of prognosis for patients in geriatric wards is essential. This has been substantiated by models such as the prognostic index (PI) [9]. Clinical information about interleukin (IL)−6 and albumin (ALB) offer greater predictive value than prediction models based solely on CGA for hospitalised older patients [10]. Therefore, combining CGA with clinical data is valuable for building predictive models [10, 11]. However, the performance of updated prognostic models based on CGA and clinical data remains insufficient, with a maximum C-index of 0.76 for older inpatients [12]. This underscores the need for a reliable prognostic model that includes latent variables from CGA and clinical data, as a reliable model would empower clinicians to predict patient prognoses and devise effective treatment strategies. To this end, we aimed to construct a user-friendly, high-performance prognostic model for older patients admitted to geriatric wards. To achieve this, we collected readily accessible CGA and clinical data from standard administrative sources shortly after admission.
We followed the guidelines of the Transparent Reporting of a Multivariate Prediction Model for Individual Prognosis or Diagnosis Statement [13]. Clinical trial number: not applicable.
We developed and validated a prognostic model for 1-year all-cause mortality among patients aged ≥ 65 years who were admitted to the Department of Geriatrics at a tertiary general hospital between January 1st, 2018 and December 31st, 2019. The inclusion criterion was a hospital stay > 48 h. The exclusion criteria were death, transfer to other departments while hospitalised, and refusal to provide written informed consent to join the CGA cohort. We analysed data only from the first admission of patients who required repeated hospitalisation during the study period (Supplementary text and Supplementary Table E1).
Participants who were included in the analysis had provided informed consent during the establishment of the CGA cohort. This study was conducted in strict accordance with the principles outlined in the Declaration of Helsinki (http://www.wma.net/en/30publications/10policies/b3/index.html). Ethical approval for the study was granted by the Research Ethics Committee at Peking Union Medical College Hospital (Approval Number: K22C0566), and the requirement for re-obtaining informed consent was waived due to the analysis of anonymized data.
Baseline information about demographic characteristics, medical history, serum laboratory results, and CGA was acquired from standardised forms in an electronic medical records system. The CGA was conducted by trained investigators who were blinded to variables and outcomes. They evaluated activities of daily living (ADLs), physical function, cognition, nutrition, psychological status, frailty status, comorbidities, and polypharmacy (Supplementary Table E2). The investigators were also blinded to the data collection forms. They conducted follow-up evaluations at monthly intervals until either the endpoint was reached or the 18th follow-up was completed.
All-cause mortality was the primary outcome of the follow-up. Information was collected from telephone interviews and clinical records. Death was assessed blindly, without knowledge of the potential predictor variables being investigated.
Geriatricians and investigators from various disciplines collaborated to identify predictors for further assessment using a prognostic model. Of the 50 initially compiled baseline variables, 18 potential predictors were selected based on literature review and clinical judgement (Supplemental text; Table E3). We appropriately transformed continuous predictors to satisfy linear associations with outcomes and improve model fit (Supplemental Text; Figure E1).
Variables are expressed as medians and interquartile ranges, and categorical variables are expressed as frequencies. Follow-up duration was calculated from the baseline date to the date of death or the last (18th ) follow-up evaluation before the study was concluded. Incomplete follow-up was terminated on the date of the last visit. The median follow-up was estimated using reverse Kaplan–Meier curves [14]. All data were statistically analysed using R version 3.4.3 (http://www.R-project.org/).
A formal sample size was not calculated because the cohort is ongoing. To ensure sufficient precision in estimating regression coefficients, a minimum of 10 death events per coefficient was estimated using the model. Consequently, the number of events per variable in the final model had to be ≥ 10. Predictors with missing values exceeding 20% were not considered candidate predictors. Missing data were examined for patterns of missingness (Supplemental Text and Figure E2). Multiple imputation techniques based on chained equations implemented in R were used to assign missing predictor values [15]. Multiple imputations were applied to model all candidate predictors with missing data along with the outcome variable, all relevant predetermined predictors (Table E3), and the estimation of cumulative hazards function [16].
Our model was improved using the least absolute shrinkage and selection operator (LASSO) method [17] to reduce overfitting and identify the best predictors. The optimal model was determined via cross-validation (Supplementary Figure E3). We then developed a Cox regression model [18] with five predictors to create a final model. We tested the Cox proportional hazard assumption using Schoenfeld residuals for each covariate (Supplementary Text in Figure E4) [19]. The probability of all-cause death for an individual patient at 1 year (Pat 1 year) after discharge from hospital was calculated as:
$$\:{P}_{at\:1\:year}=1-{S}_{0\:}{\left(t\right)}^{\text{e}\text{x}\text{p}\left(\text{p}\text{r}\text{o}\text{g}\text{n}\text{o}\text{s}\text{t}\text{i}\text{c}\:\text{i}\text{n}\text{d}\text{e}\text{x}\right)}$$
where the prognostic index is the product of predictors and their coefficients and S0(t) represents the probability of 1-year survival. We constructed a nomogram for the model based on the final variables [20].
We assessed the predictive performance of the model using the Harrell concordance index (C-index) [21]. An ensemble reliability score was calculated based on the Brier reliability component [22], which simultaneously accounts for discrimination and calibration. The observed and predicted hazards of all-cause death were evaluated using calibration curves [23]. The clinical applicability of the model was determined using decision curve analysis [24]. The model performance was validated by calculating the optimism-corrected value using the bootstrap method [25], average optimism-adjusted overall C-statistics, and Brier scores. A multidimensional GPI was established for assessing long-term survival in older adults in Korea based on the CGA [8]. The PI is a predictive model for 1-year mortality among patients aged ≥ 70 years after hospitalisation, incorporating multidimensional variables such as function, disease, and biochemical values [9]. We then compared performance between the present and previous models.
The imputed dataset was divided into three groups based on the 80th and 95th percentiles of probability distribution using the final prognostic equation, and a summary of mortality risk stratification. The robustness of the model was assessed using sensitivity analysis with the imputed datasets and complete data.
We analysed 486 of the 816 patients with confirmed mortality status (Fig. 1). Table 1 shows the baseline clinical characteristics of the patients over a follow-up period of 644 patient-years. The median follow-up determined from reverse Kaplan–Meier curves was 1.5 years, and all patients were followed up for at least 1 year.
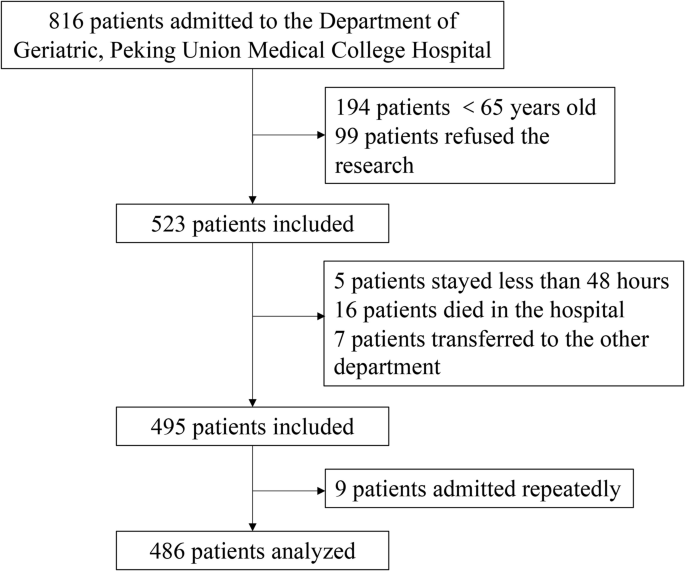
Flow chart showing the patients analysed in the study
A total of 816 potential participants were identified. After excluding those who did not meet the age criteria and those who refused to participate, 523 patients were screened according to the inclusion and exclusion criteria. Following the screening process, 495 patients were included in the study. However, since 9 of the patients were hospitalized twice, only the first hospitalization record was included. Ultimately, 486 patients were included in the analysis.
The LASSO Cox regression model selected five variables with non-zero coefficients among the 18 candidate predictors of all-cause mortality. Table 2 lists the final variables.
The prediction model was based on follow-up data from 486 patients (57 events). The coefficients, hazard ratios, and 95% confidence intervals (CIs) of the variables in the imputed dataset were estimated by fitting the Cox proportional hazards model (Table 3). The cumulative risk of all-cause death within 1 year was calculated for individual patients as follows:
$$\:{P}_{at\:1-year}=1-{0 \cdot 9631908}^{\text{e}\text{x}\text{p}\left(prognostic\:index\right)}$$
where prognostic index represents − 0·008 × ADL-0·141 × ALB + 0·357 × Charlson Comorbidity Index (CCI) + 0·027 × FRAIL-0·061 × MNA-SF.
We created a nomogram to predict the survival probability of the patients (Fig. 2). Points calculated using a calliper were summed to represent a total score on a 1-year incidence scale.
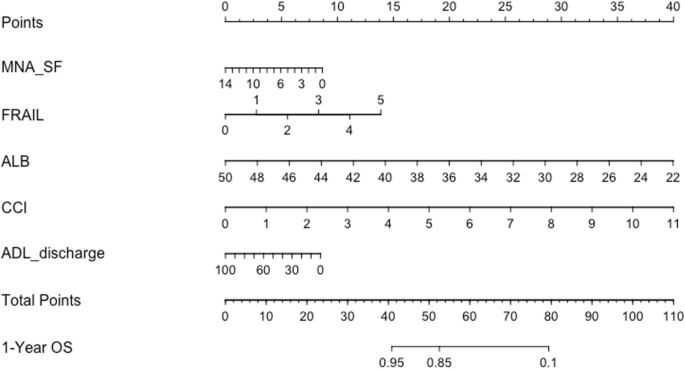
The nomogram for the model based on the final selected variables
Based on the nomogram, for elderly inpatients, after a comprehensive assessment, each result was assigned a score based on the scoring in the first row. For instance, an MNA-SF assessment of 6 points corresponds to a score of 5 points; a FRAIL score of 3 points corresponds to a score of 9 points; an albumin level of 30 g/L corresponds to a score of 29 points; a CCI score of 7 points corresponds to a score of 26 points; and a discharge ADL score of 60 points corresponds to a score of 4 points. Based on the above information, the total score calculated is 73 points. On the total score scale, the estimated survival rate within one year after discharge is less than 50%.
We assessed the performance of the model over 1 year based on 486 patients with 48 events. The apparent C-index of the model was 0·917 (Fig. 3A). The prediction model had an optimism-corrected C-index of 0·911 and a Brier score of 0·058, with bootstrap adjustment for optimism. The calibration curve shows a comparison between the predicted and observed outcomes (P = 0·304; Fig. 3B). The results of the decision curve analysis showed that the prediction model was clinically applicable when compared with universal or no screening (Fig. 4). The C-index of our model was superior to that in previous studies (PI, 0·885; MPI, 0·828).

The model’s C-index at 1 year (A) and its calibration plot (B). A This figure presents the discrimination curve of the constructed prediction model, evaluated using the C-Index as a metric. In the graph, the x-axis represents the threshold of prediction probabilities, while the y-axis indicates the model’s discrimination at different thresholds. The closer the curve is to the top left corner, the stronger the model’s ability to discriminate. In this study, the area under the curve (AUC) is 0.917. B This figure illustrates the calibration plot for the developed prediction model. In the scatter plot, each point represents a bin of predicted probabilities, with the x-axis indicating the mean predicted risk and the y-axis showing the observed risk. The diagonal line represents perfect calibration, where the predicted risk matches the observed risk exactly. Points that fall close to this line indicate that the model’s predictions are well-calibrated. In this plot, the points are generally aligned with the diagonal line. This means that the model’s estimated probabilities of the event occurring are reliable and correspond closely to the actual incidence of the event in the study population

Decision curve analysis of the prediction model compared with universal screening patients and no screening approaches
The Decision Curve Analysis (DCA) for the predictive model developed is a graphical tool used to evaluate the clinical utility of risk prediction models by assessing the trade-offs between the benefits of true positive predictions and the harms of false positive predictions across a range of threshold probabilities. In the DCA plot: The x-axis represents the threshold probability, which is the probability at which a patient would be treated or considered for an intervention. The y-axis represents the net benefit, which is calculated as the difference between the proportion of true positives and the proportion of false positives at each threshold probability, adjusted for the relative harm of false positive results.
Red curve: It represents the “intervene in all” strategy. This means intervening with patients regardless of their risk. The red curve shows the net benefit of this strategy across the entire risk threshold range. If the red curve is above other curves, then intervening with all patients may be more beneficial than other strategies within this risk threshold range.
Green curve: It represents the “do not intervene in any” strategy. This indicates that no intervention is made for patients regardless of their risk. The green curve is usually at or near the zero line, as not intervening typically does not produce additional net benefits but can avoid the costs and potential risks of intervention.
Blue curve: It represents the predictive model in this study. This curve shows the net benefit of using the predictive model to guide intervention decisions at different risk thresholds. If the blue curve is higher than the red and green curves, then using the predictive model to determine which patients should receive interventions is more beneficial than intervening or not intervening with all patients at this risk threshold range.
We assigned patients to three groups based on cutoff points at the 80th and 95th percentiles of the imputed probability distribution. These were subsequently reassigned based on risk distribution into high (> 0·46), medium (0·13‒0·46), and low (< 0·13) risk groups. Analyses of imputed and complete datasets using C-indices at 1 year revealed sensitivity of 0·916 and 0·899, respectively (Supplementary Text in Figure E5A). The calibration curves showed good convergence between the predicted and observed risks in the imputed (P = 0·304) and complete (P = 0·645) datasets (Supplementary Text in Figure E5B). Decision curve analysis revealed the clinical applicability of the prediction model in derivation and sensitivity analyses (Supplementary Text in Figure E6). Kaplan–Meier overall survival (OS) curves of the imputed and complete datasets substantially differed among the three groups (Fig. 5).

Kaplan–Meier OS curves among the three risk groups in the imputed dataset (A) and the complete dataset (B). This figure displays the Overall Survival (OS) curves estimated by the Kaplan-Meier method for three risk groups in the imputed dataset (A) and the complete dataset (B), representing the survival probabilities over time. The following is a detailed description:
Figure (5A) presents the Kaplan-Meier OS curves for the imputed dataset. Here, the survival probabilities for the three risk groups (low-risk, intermediate-risk, and high-risk) differ as time progresses, with each group represented by a curve of a different color. Over time, we can observe the survival differences between the different risk groups. Figure (5B) shows the Kaplan-Meier OS curves for the complete dataset. Similar to Fig. (5A), this figure also displays the survival probabilities for the three risk groups, but the analysis based on the complete dataset may provide more accurate results.In both figures, the x-axis represents time, typically measured in months, while the y-axis represents the survival probability. The downward slope of the curves indicates a decrease in survival probability over time. Additionally, the data on the number of individuals at risk is provided at the bottom of the figure, showing the number of survivors remaining in each group at different time points.
We developed a clinical prediction model to assess the risk of death within the year immediately following discharge from geriatric wards. Our nomogram identified patients who were at increased risk of death within this time frame. Our internal validation of the model confirmed its reliability and performance. Decision curve analysis revealed the clinical applicability of the model across various threshold probabilities. These findings indicate that our model is particularly relevant for identifying patients in geriatric wards with a high mortality risk. We identified three risk groups based on predicted probability and clinical applicability. The robustness of our regression model was determined using sensitivity analyses.
An objectively measured and readily accessible set of variables enabled us to construct this model for integration into routine practice. The included variables were the Barthel index score for ADLs at discharge, serum albumin level, CCI, FRAIL scale scores, and Mini-Nutritional Assessment-Short Form (MNA-SF) scores. These respectively address function, biological indicators, disease burden, overall status, and nutritional status. The predictive significance of individual variables in assessing mortality risk among older patients has been established. A close inverse correlation has been identified between ADL measured using the Barthel index and mortality [26]. Furthermore, when combined with other risk factors, ADLs have potential as predictors of short-term mortality among institutionalised older adults [26]. A low serum albumin level that represents malnutrition to some extent, is a prognostic factor for death among older adults [10] The ability of the disease burden to predict death has been evaluated and the CCI is an important predictor in this context [27]. The results of a systematic review and meta-analysis have indicated that frailty is a significant predictor of mortality [28], and that malnutrition leads to poor survival [29].
We thoroughly examined several variables in previous models and subsequently incorporated some of them into our final model. For instance, albumin and ADL were incorporated in a study on 1-year post-hospitalisation mortality among medical patients aged ≥ 70 years [9]. Inclusion of the CCI and MNA-SF has previously been limited. We incorporated the Comorbidity Index and Mini Nutritional Assessment within the MPI with comparable clinical significance. Although various tools are available to assess disease burden and nutritional status, we selected this version for our model based on its simplicity and widespread accessibility.
Frailty has rarely been incorporated as a variable in predictive models, and a lack of consensus on a standardised frailty assessment tool hinders its clinical applicability as a unified indicator for mortality prediction. We, therefore, opted for the concise and versatile FRAIL scale tool that comprises five questions that can be self- or caregiver-assessed. This is practical and suitable for clinical implementation. As the predictive value of frailty for mortality gains recognition, clinicians have increasingly advocated for incorporating patient frailty status into clinical decision-making [30, 31]. Therefore, frailty is an important potential variable. The finally selected predictors were further validated via expert opinions regarding clinical plausibility, feasibility, and applicability.
Our model offers several advantages. It builds upon data modelling of hospitalised older patients with multisystem clinical manifestations and is thus suitable for assessing such patients. A specialised medical model has historically prioritised disease-focused care. However, the significance of functional status among older patients is essential to recognise alongside disease management. Prognostic information derived from the systematic evaluation of patients aligns more closely with real-world clinical practice. We evaluated ADLs, frailty, and nutritional status, all of which are crucial components of a comprehensive evaluation of older individuals and relevant to their needs. These indicators have often been overlooked because of the predominant reliance on data obtained from electronic medical record systems in constructing existing prediction models [4]. We selected potential variables considering the comprehensive assessment and clinical data of older patients as potential predictors. The potential value of combining clinical and CGA data to build predictive models supports the foundation of the model [10, 11]. However, although a combination of clinical data and CGA updated the MPI, the model performance was insufficient, with a maximum C-index of 0.76 [12]. The C-index of our model at 1 year was 0·917, which was superior to that of previous models validated in this cohort (PI, 0·885; MPI, 0·828). Consequently, CGA data typically lacks disease coding and is often excluded from data platforms. Our model was constructed using readily available variables and a specific formula, enabling its direct application in the clinical setting and potential for external validation.
The development and validation of our model strictly adhered to established guidelines. We applied LASSO regression to reduce dimensionality. This surpassed the conventional approach of selecting predictors solely based on the strength of their univariate association with an outcome. The results of sensitivity analyses of the complete and imputed data confirmed the clinical usefulness of our model.
The collective analysis discerned 1-year mortality risk among discharged older patients and confirmed the effectiveness of our model. Earlier models have high predictive accuracy but are more suitable for big data platforms than for everyday medical decision-making and palliative care. Personalised and comprehensive assessment data can serve as impartial criteria that offer an objective foundation for the provision of palliative care. This is important in the context of geriatric wards, particularly with respect to collaborative decision-making between doctors and older patients regarding care interventions. In turn, this can facilitate deliberations regarding end-of-life care alternatives, including hospice palliative care. Engaging in these dialogues might be challenging but are essential to ensure that older patients receive care aligned with their goals and preferences. This would improve their QOL and help to alleviate stress for patients and their families.
Our model has several limitations. The standardisation of geriatric comprehensive assessments poses a challenge, especially when implemented across diverse healthcare institutions. The complexity of comprehensive assessments further confuses this issue. For instance, numerous tools are available to assess frailty; however, we used common and relatively simple tools with enhanced applicability in the clinical setting. This study was conducted at a single centre, and the verification process was limited to internal validation, which indicated favourable model performance. Therefore, for future research, conducting multi-center studies is crucial, which requires incorporating data from multiple centers to develop databases and update models. Notably, external validation holds a key position in assessing the model’s generalized applicability.
We developed and internally validated a risk stratification model using readily accessible clinical predictor data for a longitudinal cohort of older patients discharged from the hospital. By providing individualised risk estimates, this model could aid clinicians identify patients with the greatest likelihood of mortality, facilitating personalised strategies for such individuals during discussions about end-of-life care options, including palliative hospice care. To ensure the accuracy of the model in diverse patient populations, external validation is necessary.
The datasets analysed in the current study are not publicly available as they are part of an ongoing study. However, data are available from the corresponding author on reasonable request.
- ADL:
-
Activities of daily living
- CCI:
-
Charlson Comorbidity Index
- CGA:
-
Comprehensive geriatric assessment
- IL-6:
-
Interleukin
- QOL:
-
Quality of life
- MPI:
-
Multidimensional prognostic index
- GPI:
-
Geriatric prognostic index
- LASSO:
-
Least absolute shrinkage and selection operator
- MNA-SF:
-
Mini-Nutritional Assessment-Short Form
- OS:
-
Overall survival
- PI:
-
Prognostic index
The authors thank all investigators, study coordinators, and patients who participated in the study.
This research is supported by the National High-level Hospital Clinical Research Funding (Project No. 2022-PUMCH-B-129). Funders were not involved in the design, collection, analysis, interpretation, or writing this report.
The Research Ethics Committee at the hospital approved this study (Approval No: K22C0566) and waived the need for informed consent because we analysed innominate data.
Not applicable.
The authors declare no competing interests.
Springer Nature remains neutral with regard to jurisdictional claims in published maps and institutional affiliations.
Open Access This article is licensed under a Creative Commons Attribution-NonCommercial-NoDerivatives 4.0 International License, which permits any non-commercial use, sharing, distribution and reproduction in any medium or format, as long as you give appropriate credit to the original author(s) and the source, provide a link to the Creative Commons licence, and indicate if you modified the licensed material. You do not have permission under this licence to share adapted material derived from this article or parts of it. The images or other third party material in this article are included in the article’s Creative Commons licence, unless indicated otherwise in a credit line to the material. If material is not included in the article’s Creative Commons licence and your intended use is not permitted by statutory regulation or exceeds the permitted use, you will need to obtain permission directly from the copyright holder. To view a copy of this licence, visit http://creativecommons.org/licenses/by-nc-nd/4.0/.

Li, J., Kang, L., Liu, X. et al. Development of a multidimensional 1-year mortality prediction model for patients discharged from the geriatric department: a longitudinal cohort study based on comprehensive geriatric assessment and clinical data. BMC Geriatr 25, 230 (2025). https://doi.org/10.1186/s12877-025-05734-x
Received:
Accepted:
Published:
DOI: https://doi.org/10.1186/s12877-025-05734-x