Lipids in Health and Disease volume 24, Article number: 174 (2025) Cite this article
The widespread presence of per-and polyfluoroalkyl substances (PFAS) has raised global health concerns. This study aims to determine the age-specific relationships of PFAS compounds with metabolic syndrome (MetS) and its components.
We used data from the National Health and Nutrition Examination Survey (NHANES) in 2003–2018. Modified Poisson regression was employed to estimate associations between individual PFAS compounds and prevalence of MetS, as well as its components. Multiple linear regression analyses were performed to examine the associations between PFAS congeners and metabolic markers, including lipid and glucose homeostasis traits. Additionally, weighted quantile sum (WQS) regression and Bayesian kernel machine regression (BKMR) models were conducted to investigate the joint effects of PFAS mixtures on the prevalence of MetS and its components across different age groups.
A total of 5850 participants were included for analysis. In the Modified Poisson regression model, ln-transformed perfluorononanoic acid (PFNA) level was positively correlated with MetS prevalence in adolescents (prevalence ratio [PR] = 1.42; 95% CI: 1.01–1.99). Conversely, ln-transformed perfluorohexanesulfonic acid (PFHxS) and ln-transformed 2-(N-Methylperfluorooctane sulfonamido) acetic acid (MeFOSAA) were negatively associated with the risks of MetS in young adults (PR = 0.86, 95% CI: 0.76–0.98) and middle-aged adults (PR = 0.88, 95% CI: 0.79–0.98), respectively. Notably, individual PFAS exposure was positively associated with levels of total cholesterol, low-density lipoprotein, non-high-density lipoprotein, and high-density lipoprotein in young and middle-aged adults. However, overall effect analyses using WQS and BKMR showed no significant associations of PFAS mixture with MetS in any age group. Nonetheless, in middle-aged adults, PFAS mixture was adversely correlated with hypertriglyceridemia and positively linked to a greater risk of hypertension and increased high-density lipoprotein cholesterol levels.
Our study highlighted the complex relationships between PFAS exposure and the risks of MetS and its components across different age groups. Co-exposure to PFAS was particularly linked to dyslipidemia in young and middle-aged adults. Prospective studies are needed for better comprehension of the causative impact of PFAS on the risks of MetS.
The incidence of metabolic syndrome (MetS) has greatly increased over the past three decades, emerging as a global public health issue [1, 2]. MetS is characterized by several metabolic dysregulations, including abdominal obesity, impaired glucose homeostasis, lipid dysregulation, and hypertension [3]. It has long been considered as a risk factor for many chronic diseases, such as cardiovascular disease, diabetes, and even all-cause mortality [4]. Although factors such as age, physical activities, lifestyles, and overnutrition are well-established contributors to MetS [5], they cannot fully explain its prevalence and etiology.
Increasing evidence links environmental pollutants to the incidence of metabolic disorders, suggesting they could act as endocrine disruptors [6, 7]. Per-and polyfluoroalkyl substances (PFAS), emerging pollutants commonly known as “forever chemicals”, are a group of synthetic chemicals with carbon-fluorine structures. Because of their excellent lipophobic and hydrophobic properties, PFAS have been extensively applied as water- and oil- resistant agents, as well as anti-fouling agents in various products [8]. As a result, PFAS have become common pollutants found not only in various environmental compartments but also in both wildlife and humans [9,10,11]. The biological half-lives of PFAS in human tissues could be as long as 25 years [12]. As the endocrine disruptors, PFAS exposure can activate transcription receptors to disrupt endocrine homeostasis and induce metabolic dysfunction [13, 14]. Long-term and continuous exposure to PFAS may lead to chronic metabolic diseases [15, 16].
PFAS was associated with abdominal obesity [17], hypertension [18], dyslipidemia and impaired glucose metabolism [7, 19]. These abnormalities are not only critical components of MetS but also contribute to its development. Limited research has reported the links between PFAS and the risks of MetS [20,21,22], with findings remaining inconsistent among different age groups. The variety of PFAS sources and their respective contributions to human exposure vary based on age-associated behaviors and dietary patterns, leading to differences in health impacts. For instance, exposure to PFAS during pregnancy has been positively correlated with the risk of MetS in children and adolescents [6]. However, a study among the elderly has found null relationship between PFAS and MetS [21]. Thus, it is reasonable to speculate that age may be a key factor in the relationship between PFAS and MetS. Additionally, the presence of multiple pollutants in environment also raised concerns. Exposure to PFAS mixture has been found to exert joint effects on lipid metabolism and metabolic function [23], with co-exposure potentially resulting in greater toxicity than individual compounds [24]. Despite the widespread presence of multiple PFAS congeners in the environment, few research has investigated the age-specific association between PFAS mixture and the risk of MetS. Therefore, it is crucial to comprehend the relationships between PFAS co-exposure and MetS across different age groups.
Additionally, PFAS exposure may affect both lipid and glucose homeostasis. It has been reported that consistent positive associations were found between PFAS exposure, particularly PFOA and PFOS, and total cholesterol (TC) and low-density lipoprotein cholesterol (LDL-C) levels in adults [25]. However, evidence regarding the associations between PFAS exposure and triglyceride (TG) levels exhibited heterogeneity in the existing meta-analyses, while the relationship with non-high-density lipoprotein cholesterol (NHC) remained inconclusive [25]. Data from the Diabetes Prevention Program revealed that plasma PFAS concentrations were positively associated with increased fasting insulin and HOMA-IR, but not with glucose levels in adults [26]. Conversely, the Danish Odense Child Cohort demonstrated elevated glucose trajectories in association with prenatal PFAS exposure [27]. These discrepant findings highlight the need to clarify PFAS-induced metabolic disruptions across heterogeneous populations.
We aimed to evaluate age-specific associations between PFAS exposure (both individually and in combination) and the risk of MetS, as well as related metabolic markers, using data from a national program. We hypothesized that: (1) the relationships between each PFAS compound and MetS would vary across different age groups; (2) PFAS mixture would induce synergistic or cumulative effects on MetS and its components across different age groups; (3) the contribution of each congener to MetS and its components would differ across different age groups.
The National Health and Nutrition Examination Survey (NHANES) is a nationally representative project administered by the National Center for Health Statistics (NCHS). Due to the availability of PFAS data starting from 2003 to 2004, this study included 8 continuous survey cycles (2003–2004, 2005–2006, 2007–2008, 2009–2010, 2011–2012, 2013–2014, 2015–2016, 2017–2018), comprising a total of 80,312 participants. The exclusion criteria were as follows: (1) age < 12 years, n = 23,139; (2) pregnant women, n = 1046; (3) missing health examination data, n = 2217; (4) missing PFAS data, n = 37,854; (5) incomplete data on MetS components, n = 9321; (6) incomplete data on covariates, n = 885. Ultimately, the analytical dataset included 5850 participants, and the selection workflow was shown in Fig. S1. The protocol obtained approval from the NCHS Ethics Review Board, with all participants providing signed informed consent at enrollment.
PFAS were extracted from serum and detected by high-performance liquid chromatography coupled with tandem mass spectrometry and online solid phase extraction. Six PFAS congeners, including 2-(N-methyl-perfluorooctane sulfonamido) acetic acid (MeFOSAA, detection rate [DR]: 57.19%), perfluorodecanoic acid (PFDA, DR: 73.08%), perfluorohexanesulfonic acid (PFHxS, DR: 98.46%), perfluorononanoic acid (PFNA, DR: 98.44%), perfluorooctanoic acid (PFOA, DR: 99.71%), and perfluorooctanesulfonic acid (PFOS, DR: 99.82%) were included in our study for analysis, each with a detection rate over 50% (Table S1). Since PFOA and PFOS were quantified with both linear and branched isomers in NHANES during 2013–2018 but only total levels detected during 2003–2012, the total concentrations of liner and branched isomers of PFOA and PFOS were applied for analysis in our study according to the guideline of NHANES, respectively. The limits of detection (LOD) of analyzed compounds ranged from 0.08 to 0.52 ng/ml (Table S1). The detections below LOD were calculated with LOD/ \(\:\sqrt{2}\), as recommended by NHANES.
For participants ≥ 20 years old, MetS was diagnosed based on the criteria of the National Cholesterol Education Program Adult Treatment Panel III (NCEP ATP III) [28]. For adolescent MetS (aged 12–19 years), the diagnosis followed the criteria reported previously [29]. The detailed information can refer to Table S2 in Supporting Information.
In addition, other metabolic markers, including TC, LDL-C, NHC, fasting insulin, glycohemoglobin (HbA1c), and homeostatic model assessment for insulin resistance (HOMA-IR), were included in the analysis. HOMA-IR was calculated as previously reported [30].
According to previous reports [31,32,33], the following confounders were included as covariates: gender (male and female), ethnicity (categorical variable), education level (categorical variable), and income-to-poverty ratio (PIR, continuous variable), drinking (yes, no), smoking (yes, no), daily energy intake (continuous variable), survey cycle (categorical variable), and body mass index (BMI, continuous variable). Drinkers in adults (aged ≥ 20 years) were defined as individuals having more than 12 drinks (a drink = 12-ounce beer / 4-ounce glass of wine / an ounce of liquor) in one year, and adults who have smoked a minimum of 100 cigarettes throughout their life were classified as smokers. Since questionnaire data on adolescents’ alcohol use are not available, we extracted alcohol intake data from 24-hour dietary recall interviews to define those had an estimated alcohol intake above zero as drinkers among adolescents. A smoker in adolescent was defined as the participant who has smoked at least one or more cigarettes.
Participants were categorized into adolescents (12–19 years), young adults (20–39 years), middle-aged adults (40–59 years), and the elderly (≥ 60 years) for age-specific analysis. Survey weighted median (25th percentile – 75th percentile) and frequencies (weighted proportion) were used to describe continuous variables and categorical variables, respectively. Differences between MetS and non-MetS groups were determined using Wilcoxon sum-rank test for continuous variables and chi-squared test for categorical variables. Correlation coefficients between pairs of PFAS congeners were examined with Spearman correlation analysis. Due to their skewed distributions, ln-transformed PFAS concentrations were used in the regression analysis.
Survey-weighted multivariable Modified Poisson regression with robust standard errors was utilized to assess the age-specific associations of each PFAS compound with MetS and its components (central obesity, hypertension, low HDL-C, hypertriglyceridemia, and hyperglycemia), all treated as binary outcomes. PFAS concentrations were either regarded as continuous variables or categorized into four quantiles. Prevalence ratios (PRs) and related 95% confidence interval (95% CI) were calculated. Survey-weighted linear regression was employed to examine the linear relationships between serum ln-transformed PFAS and ln-transformed metabolic markers. The regression coefficient (β) was calculated for the linear relationships, with results presented as percentage changes (percentage change = 100% × [1.01^ (β) − 1]) in risks [34, 35].
Next, weighted quantile sum (WQS) regression in conjunction with binary logistic regression was conducted to examine the overall impacts of PFAS mixtures on MetS and the individual contributions of PFAS compounds. WQS model is widely applied to analyze the joint health effects of multiple chemical exposures on humans [33, 36]. In the current study, the dataset was randomly divided into training (40%) and validation (60%) sets, with a bootstrap setting of 5000 iterations. WQS regression was performed in both positive and negative directions based on the index incorporating all PFAS compounds. The weight of each PFAS congener ranged from 0 to 1, with the sum of the weights equaling 1.
Then, Bayesian kernel machine regression (BKMR) analysis with 10,000 iterations was applied through the Markov chain Monte Carlo (MCMC) algorithm to confirm the combined effects of PFAS mixture exposure on the risk of MetS. Using a Gaussian kernel function, BKMR iteratively regresses the exposure-response relationship to flexibly fit curves, capturing both non-linear and non-additive correlations [37]. The contribution of each chemical to the risk of MetS was presented with posterior inclusion probabilities (PIPs). PFAS concentrations were ln-transformed and normalized using z-score method. Probit regression implementation was used for binary outcomes. Overall and single-exposure effects were estimated as previously described [37].
Lastly, several sensitivity analyses were performed. (a) Kidney function has been reported to affect the excretion of PFAS, with glomerular function negatively linked to serum PFAS levels [38]. Thus, we excluded participants whose estimated glomerular filtration rate (eGFR) was less than 60 mL/min/1.73 m2 (Table S3 and S4) and reexamined the relationships between PFAS and MetS. The eGFR was calculated based on previous reports [39, 40]. (b) Given that outliers can distort statistical analyses, participants with ln-transformed PFAS levels greater than the mean ± 3SD [41] were excluded for sensitivity analyses. (c) To address potential bias from substituted values, participants with non-detectable serum PFAS levels (< LOD) were excluded for analysis. (d) To assess the impacts of imbalance dataset when performing WQS regression, we applied the Synthetic Minority Oversampling Technique (SMOTE) to generate a balanced dataset of adolescents. Additionally, we implemented class weighting to adjust for minority class influence. (e) To confirm our findings across different extensions of binary outcomes, we conducted additional analyses using Modified Poisson regression with robust variance estimation for implementing WQS. (f) We incorporated age as a continuous variable into the BKMR model alongside all PFAS exposures to further validate the effect of PFAS mixture.
All statistics were conducted with R software (version 4.2.3). The packages used in our analysis were “survey”, “gtsummary”, “corrplot”, “gWQS” (version 3.0.5), “bkmr” (version 0.2.2), and “ggplot2”. P < 0.05 was defined as statistical significance.
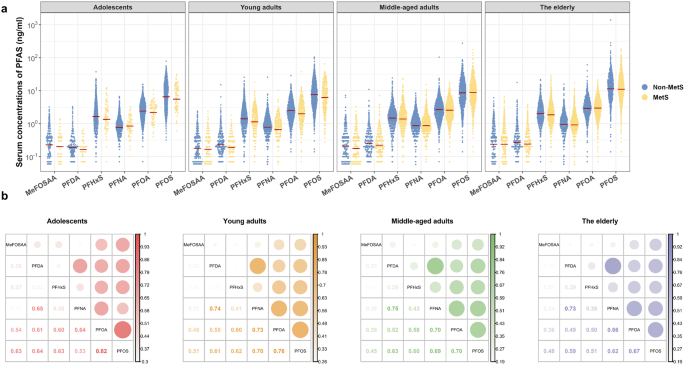
Eventually, 5850 participants were included in the analysis, and their characteristics were summarized in Table 1. An increasing prevalence of MetS with age was observed across the groups: 7.60% among adolescents, 22.61% among young adults, 44.34% among middle-aged adults, and 57.07% among the elderly. Equal gender distributions between participants with and without MetS were found in all age groups (P > 0.05), except for a slightly higher portion of males with MetS than females among young adults (P < 0.05, Table 1). Individuals with MetS tended to have higher waist circumference, blood pressure, TG, NHC (except for the elderly), fasting insulin, HOMA-IR, 2-hour oral glucose tolerance test (OGTT), fasting glycemia, and HbA1c (except for the adolescents) across the four age groups (Table 1). The levels and detection rates of serum PFAS in all participants were shown in Fig. 1a and Table S1. Within the overall population of each age group, the highest concentration of PFAS was PFOS (range of weighted geometric mean [WGM]: 6.46–11.21 ng/mL), followed by PFOA (range of WGM: 2.38–2.95 ng/mL), PFHxS (range of WGM: 1.34–1.93 ng/mL), PFNA (range of WGM: 0.76–0.93 ng/mL), PFDA (range of WGM: 0.19–0.25 ng/mL), and MeFOSAA (range of WGM: 0.18–0.24 ng/mL, Table S5). Significant correlations between each two PFAS congeners were found using Spearman correlation analysis (r = 0.19–0.82; P < 0.001, Fig. 1b).
Distribution of PFAS in the participants and the correlations between individual PFAS across the age groups. (a) Serum levels of PFAS in participants with or without metabolic syndrome (MetS). The weighted geometric mean (WGM) levels of the PFAS congener were marked as red lines. WGM in overall population, MetS and non-MetS subgroups across age groups were provided in Supplementary Table S5. (b) Spearman correlations between individual PFAS in different age groups. The correlation coefficients were presented as circles, varying in size and color
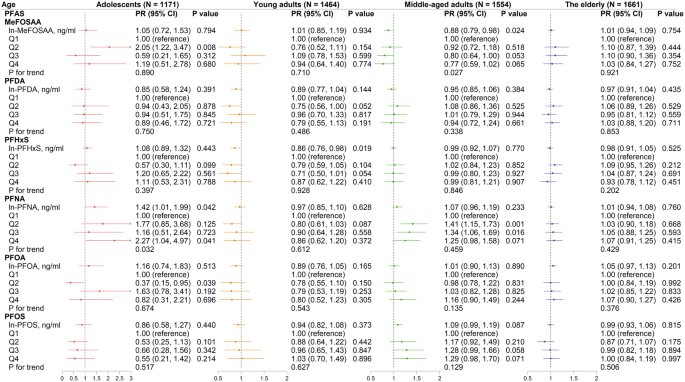
Notably, the relationships between PFAS (as continuous variables) and PRs of MetS varied across the four age groups (Fig. 2). In adolescents, a one-unit increase of ln-transformed serum PFNA was found to be correlated with a 42% increase of MetS prevalence (PR = 1.42, 95% CI: 1.01–1.99, Fig. 2) after adjusting for gender, race, education level, family income-to-poverty ratio, PIR, smoking, drinking, daily energy intake, survey cycles, and BMI. Conversely, serum PFHxS was adversely correlated with MetS prevalence among young adults (PR = 0.86, 95% CI: 0.76–0.98). A similar trend was found in middle-aged adults, where serum MeFOSAA was negatively linked with the prevalence of MetS, with a PR of 0.88 (95% CI: 0.79–0.98).
Analysis of the quartiles demonstrated that serum PFNA was positively associated with MetS prevalence among adolescents (Q4 vs. Q1, PR = 2.27, 95% CI: 1.04–4.97, P for trend = 0.032) and middle-aged adults (Q2 vs. Q1, PR = 1.41, 95% CI: 1.15–1.73; Q3 vs. Q1, PR = 1.34, 95% CI: 1.06–1.69). Furthermore, adolescents with MeFOSAA in Q2 levels had a greater risk of MetS than those with MeFOSAA in Q1 (PR = 2.05, 95% CI: 1.22–3.47). In contrast, adolescents with PFOA levels in Q2 had a lower risk of MetS than those in Q1 (PR = 0.37, 95% CI: 0.15–0.95).
Associations between ln-transformed PFAS congeners and MetS across four age groups. Modified Poisson regression approaches were used and adjusted for gender, race, education level, family income-to-poverty ratio, smoker, drinker, daily energy intake, survey cycle, and BMI. Arrow indicated that the upper CI of PR was > 3. PR, prevalence ratio; CI, confidence interval
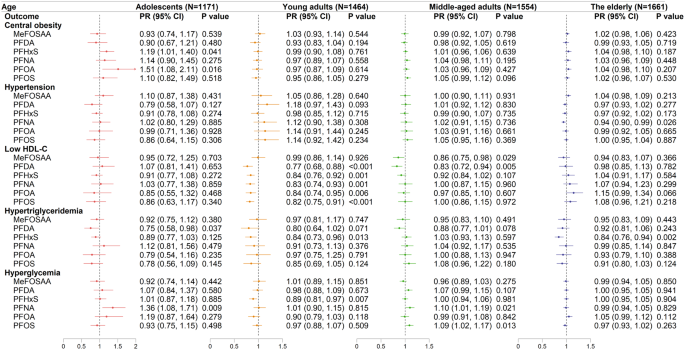
The relationships of PFAS congeners with MetS components were complicated across the four age groups. In adolescents, serum PFHxS and PFOA were positively correlated with increased risks of central obesity in confounder-adjusting models (PFHxS: PR = 1.19 [95% CI: 1.01–1.40]; PFOA: PR = 1.51 [95% CI: 1.08–2.11]) (Fig. 3). However, no significant correlations between PFAS exposure and central obesity were observed in the other three age groups. PFNA exposure linked to a decreased risk of hypertension in the elderly, with a PR of 0.94 (95% CI: 0.90–0.99). Significant negative associations between five PFAS congeners (PFDA, PFHxS, PFNA, PFOA, and PFOS) and low HDL-C were found in young adults. In middle-aged adults, MeFOSAA and PFDA exposure were also correlated with low HDL-C (MeFOSAA, PR = 0.86, 95% CI: 0.75–0.98; PFDA, PR = 0.83, 95% CI: 0.72–0.94), whereas the associations between other single PFAS congeners and low HDL-C were insignificant. In adolescents, PFDA exposure was adversely associated with hypertriglyceridemia (PR = 0.75, 95% CI: 0.58–0.98). Besides, PFHxS exposure was negatively associated with hypertriglyceridemia in young adults (PR = 0.84, 95% CI: 0.73–0.96) and in the elderly (PR = 0.84, 95% CI: 0.76–0.94).
Associations between ln-transformed PFAS congeners and the components of MetS across four age groups. Modified Poisson regression models were used and adjusted for confounding variables. Arrow indicated that the upper CI of PR was > 2. The detail information about the definition of the MetS components was listed in the Supplementary Materials
Quartile analyses also revealed significant positive associations for PFHxS (PR = 2.50, 95% CI: 1.53–4.10) and PFOA (PR = 1.87, 95% CI: 1.01–3.47) with central obesity in adolescents in Q3 compared to Q1 (Table S6). Of note, no obvious links were observed between PFAS exposure and hypertension in the elderly based on the quartiles analysis (Table S7). However, significant increases in hypertension risks were observed in adolescents exposed to PFNA (PR = 1.71, 95% CI: 1.00–2.93) and in young adults exposed to PFDA (PR = 1.84, 95% CI: 1.19–2.86) in Q3 compared to Q1 (Table S7). Interestingly, in young adults, increased concentrations of several PFAS (i.e., PFDA, PFHxS, PFNA, PFOA, and PFOS) were correlated with decreased risks of low HDL-C, showing significant decreasing trends as the quartiles increased (Table S8). Furthermore, ln-transformed PFDA in Q4 was negatively associated with hypertriglyceridemia in both adolescents (PR = 0.58, 95% CI: 0.37–0.93) and young adults (PR = 0.53, 95% CI: 0.31–0.91). A decreased risk of hypertriglyceridemia was also found in adolescents with the exposure of MeFOSAA in Q3 (PR = 0.47, 95% CI: 0.27–0.83). Nevertheless, ln-transformed PFNA was significantly associated with hypertriglyceridemia in both middle-aged adults (PR = 1.55, 95% CI: 1.15–2.08) and the elderly (PR = 1.37, 95% CI: 1.02–1.85) in Q2 compared to Q1. In middle-aged adults, compared to Q1, an increased prevalence of hypertriglyceridemia was observed with PFOS exposure in Q2 (PR = 1.35, 95% CI: 1.04–1.76) and Q3 (PR = 1.35, 95% CI: 1.01–1.81; Table S9). Moreover, in middle-aged adults, positive associations were found between both PFNA and PFOS in Q3 and hyperglycemia (PFNA, Q3 vs. Q1, PR = 1.30, 95% CI: 1.10–1.53; PFOS, Q3 vs. Q1, PR = 1.24, 95% CI: 1.04–1.49; Table S9). Exposure to PFOA increased the risks of hyperglycemia in the elderly by 1.15-fold in Q4 compared to Q1, while the risk of hyperglycemia in adolescents was increased by 1.78-fold in Q4 of PFNA compared to Q1 (Table S10).
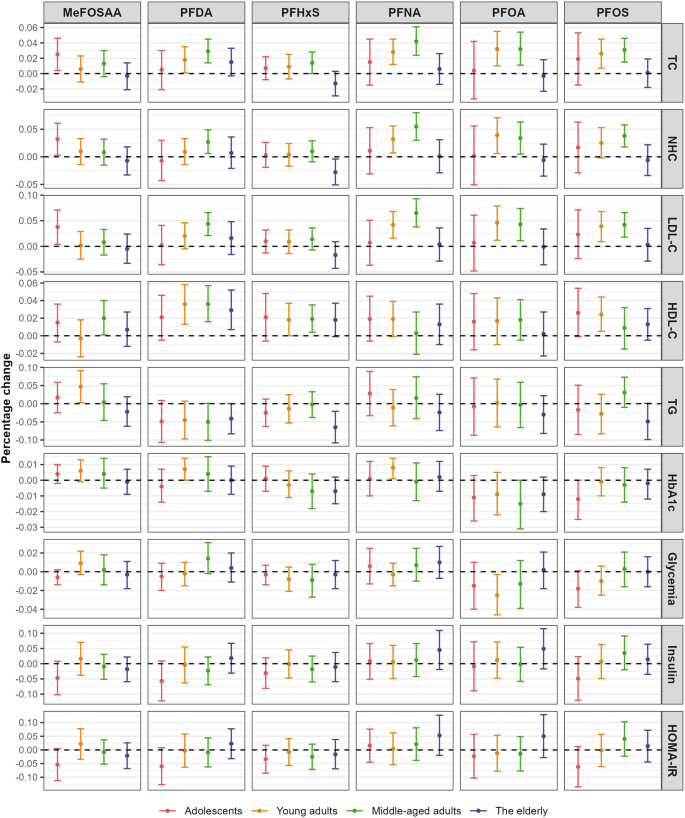
Significant disruptions in lipid metabolism were observed following PFAS exposure across different age groups. In adolescents, a 1% increase in MeFOSAA concentration was associated with a 0.025% rise (95% CI: 0.004%, 0.046%) in TC levels, a 0.032% increase (95% CI: 0.003%, 0.061%) in NHC levels, and a 0.038% increase (95% CI: 0.004%, 0.071%) in LDL-C levels. Furthermore, increasing levels of PFNA, PFOA, and PFOS were related with elevated TC, NHC, and LDL-C in both young and middle-aged adults, with percentage changes per 1% increase in PFAS levels ranging from 0.025 to 0.065%. In middle-aged adults, a 1% increase in PFDA was associated with a 0.029% increase (95% CI: 0.014%, 0.045%) in TC levels, and a 0.027% increase (95% CI: 0.006%, 0.049%) in NHC levels, and a 0.044% increase (95% CI: 0.021%, 0.066%) in LDL-C levels. Additionally, a 1% increase in ln-transformed PFDA was significantly associated with elevating HDL-C levels in young adults (percentage change = 0.036%, 95% CI: 0.013%, 0.058%) and in middle-aged adults (percentage change = 0.036%, 95% CI: 0.016%, 0.057%), and in the elderly (percentage change = 0.029%, 95% CI: 0.007%, 0.052%). In middle-aged adults, a 1% increase in MeFOSAA and PFHxS were associated with a 0.002% increase (95% CI: 0.001%, 0.004%) and a 0.019% increase (95% CI: 0.004%, 0.035%) in HDL-C levels, respectively. Notably, in young adults, a marginal positive association was found between MeFOSAA and TG levels (percentage changes = 0.047%, 95% CI: 0.003%, 0.091%), while a negative association was observed between PFHxS and TG in the elderly (percentage change = -0.065%, 95% CI: -0.108%, -0.021%, Fig. 4).
Associations between ln-transformed PFAS congeners and metabolic markers. The models were adjusted for confounding variables. TC, total cholesterol; HDL-C, high-density lipoprotein cholesterol; NHC, non-HDL cholesterol; LDL-C, low-density lipoproteins cholesterol; TG, triglyceride; HbA1c, glycohemoglobin; HOMA-IR, homeostasis model assessment of insulin resistance
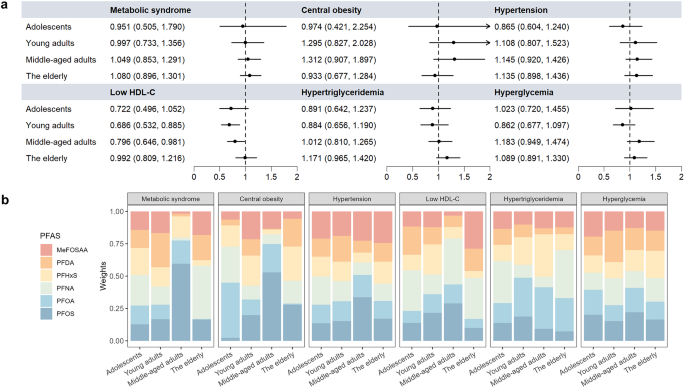
The results of WQS regression were presented in Fig. 5, Fig. S2, and Table S11-S12. When the regression was restricted to the positive direction, no significant associations were found between PFAS mixture exposure and MetS or its components across the four age groups (Fig. 5, Table S11). However, when the regression was restricted to the negative direction, significant negative associations were observed between PFAS mixture and low HDL-C in both young adults (Odds ratio [OR] = 0.667; 95% CI: 0.514–0.866) and middle-aged adults (OR = 0.710, 95% CI: 0.553–0.912) (Fig. S2A). In young adults, the six analyzed PFAS contributed equally to the overall risk of low HDL-C due to their similar weights. In middle-aged adults, MeFOSAA contributed the most to the associations of low HDL-C, followed by PFHxS and PFDA (Fig. S2B, Table S12).
Associations between PFAS mixture and MetS and its components by WQS models in the positive direction. The models were adjusted for confounding variables. (a) Odds ratios (ORs) and 95% CIs for the associations. Arrow indicated that upper confidence interval of OR was > 2. (b) Weights of individual PFAS compounds in WQS models
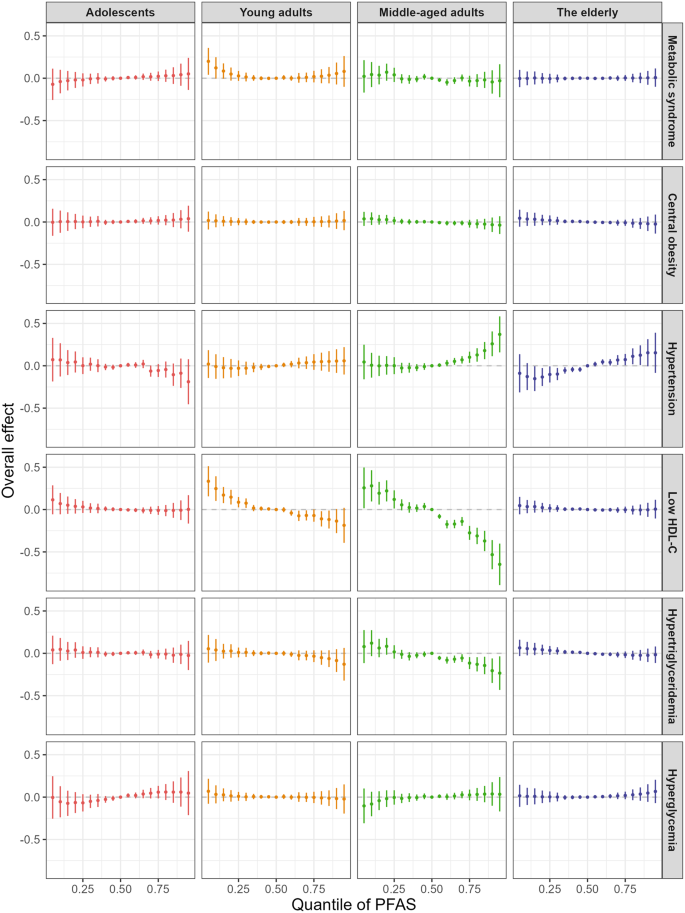
Consistent with the WQS results, no significant associations between PFAS mixtures and risks of MetS were found across any age groups in BKMR models (Fig. 6). In both young and middle-aged adults, the risk of low HDL-C significantly decreased when all PFAS at or above their 60th percentile, and dramatically rose when all PFAS at or below their 25th percentile, compared to the 50th percentile (Fig. 6). The PIPs for low HDL-C in middle-aged adults were presented in Fig. S3, with PFDA contributing the most (> 0.99), followed by MeFOSAA (0.97) and PFNA (0.76). Additionally, in middle-aged adults, the BKMR model indicated a positive relationship between PFAS co-exposure and hypertension and a negative correlation with hypertriglyceridemia. PFDA was the predominant compound associated with a decreasing risk of hypertriglyceridemia (PIP > 0.99) in middle-aged adults, whereas MeFOSAA contributed the most to hypertension (PIP = 0.60).
Estimated joint effect (95% CI) of the PFAS mixture on MetS and its components in BKMR models. Overall effect was defined as the difference in the probit of the probability of MetS when all PFAS congeners were fixed at specific quantiles (ranging from 0.05 to 0.95), compared to when all PFAS congeners were fixed at 0.5. The models were adjusted for gender, race, education, income-to-poverty ratio, smoker, drinker, daily energy intake, survey cycle, and BMI
The associations between ln-transformed PFAS and MetS across different age groups remained largely unchanged after excluding the participants with decreased eGFR (sensitivity analysis 1) or PFAS outliers (sensitivity analysis 2), as compared to the primary results (Fig. S4). However, in adolescents, the association between PFNA and prevalence of MetS was attenuated compared to the primary results and became non-significant. After excluding participants with non-detectable PFAS levels (sensitivity analysis 3), the association between MeFOSAA and MetS in middle-aged adults became non-significant (OR = 0.89, 95% CI: 0.76–1.05, Fig. S4). Additionally, the negative associations between five PFAS congeners (PFDA, PFHxS, PFNA, PFOA, and PFOS) congeners and prevalence of low HDL-C among the young adults in three sensitivity analyses remained consistent with the main analyses (Fig. S5). Using balanced data (via SMOTE or class weighting) further confirmed the null association between PFAS mixtures and MetS risk in adolescents (Table S13). Findings obtained from modified Poisson regression-based WQS models remained consistent with those from the logistic regression-based WQS models (Fig. S6). When age was included as a continuous variable alongside all PFAS exposures in the BKMR model, the overall mixture effect of PFAS on MetS risk remained non-significant across all age quantiles (0.10, 0.35, 0.60, and 0.85 quantiles, Fig. S7A). Additionally, significant negative associations were observed between PFAS mixtures and low HDL-C risk at the 0.35 and 0.60 age quantiles (31 and 50 years, Fig. S7B). Dose-response curves revealed that these inverse relationships were predominantly driven by PFDA, with stronger effects at the 0.35 and 0.60 age quantiles (Fig. S7C).
In this comprehensive, nationally representative study, high serum levels of PFAS in different age participants were observed. Age-specific correlations between individual PFAS compounds and the risks of MetS and its components were observed. Analyses using WQS and BKMR consistently indicated null correlations between PFAS mixture and MetS across four age groups. However, pronounced correlations between PFAS mixture and lipid metabolism were found in middle-aged adults. This study offers novel insights into the heterogeneous associations between individual and combined PFAS compounds and the risks of MetS across different age groups.
As emblematic indicators of environmental pollution, PFAS compounds have garnered great attention and raised public, scientific, and regulatory concerns [42]. Previous studies have reported inconsistent correlations between PFAS and MetS among different age groups [6, 21, 43]. Similar to these studies, age-specific associations between individual PFAS congener and MetS were found in our study. Notably, increased level of PFNA was associated with an increased risk of MetS in adolescents. In middle-aged adults, however, only the middle quartiles of PFNA (Q2 and Q3) had significantly increased risks of MetS, which aligns with previously reported results [44, 45]. Although a high prevalence of MetS was observed among the elderly, no significant associations between individual PFAS congeners and MetS were found in the elderly in our study, consistent with data from highly PFAS-contaminated areas [21].
The inconclusive associations between PFAS and MetS across different age groups may also be due to PFAS-specific receptor affinity, competing pathways, and varying health impacts of PFAS during distinct life periods of exposure. As endocrine disrupting chemicals, PFAS can interact with fatty acid-binding proteins and activate multiple nuclear receptors, including peroxisome proliferator-activated receptors (PPARs), pregnane X receptor (PXR), and estrogen receptor alpha (ERα), thereby inducing metabolic effects [46]. Most PFAS compounds could exacerbate adipogenesis and promote adipocyte differentiation in the presence of a PPARγ agonist, but PFHxS has been shown to significantly increase adipogenesis even without the PPARγ agonist [47]. Interestingly, in rats, PFOA exposure upregulated the expression of PPARγ, 3-hydroxy-3methylglutaryl-CoA synthase 2 (Hmgcs2), and acetyl-CoA carboxylase alpha (Acaca) but significantly reduced liver and serum levels of TG, TC, and HDL-C content by disrupting the mTOR/AMPK pathway [48]. Additionally, PFHxS exposure induced the activation of PPARα, reducing specific lipids (saturated fatty acids, oleamide, and retinol) in zebrafish [49]. This may partially explain the observed protective effect of certain PFAS on MetS in young adults. On the other hand, PFAS exposure occurs throughout the human lifespan, yet biological sensitivity to environmental pollutants varies across life stages, leading to different health impacts [50]. The biological responses of physiological systems may decrease with age, particularly in older adults [51]. Water and food intake are the primary exposure routes for PFAS in the general population [52]. Children and young individuals, who require larger amounts of water and food, along with increased respiratory and metabolic rates, may experience greater chemical exposure compared with the elderly [50]. Consequently, the impacts of PFAS exposure on MetS were more pronounced in younger individuals than in the elderly. These findings suggest age- and compound-specific variations in PFAS exposure, emphasizing the urgent need for future studies to focus on specific populations, such as adolescents and middle-aged adults.
Previous studies demonstrated that exposure to PFAS could induce dyslipidemia, leading to increases in TC, LDL-C, NHC, and HDL-C levels in both adolescents and adults [7, 53]. In the current study, linear dose-response relationships were found between certain PFAS (i.e., PFDA, PFNA, PFOA, and PFOS) with components of cholesterol metabolism, including TC, LDL-C, and NHC, in middle-aged adults. Additionally, most PFAS congeners, except for MeFOSAA, were negatively correlated with low HDL-C in young adults. Although a previous study demonstrated that PFOA exposure altered lipid metabolism in young adults, contributing to high glucose levels after OGTT [19], we found only a marginal positive association of PFOS with hyperglycemia in middle-aged adults. Our study underscores the association between PFAS and lipid metabolism, particularly cholesterol metabolism, in young and middle-aged adults. Excess cholesterol accumulation, especially LDL-C, is generally considered a risk factor for atherosclerosis and liver disease [54]. This may explain why PFAS exposure has also been linked to cardiovascular diseases [55].
It is critical to note that traditional statistical strategies are limited to analyzing either single chemicals or the simple sum of multiple chemicals, while humans are exposed to multiple PFAS compounds throughout their lifespan. Our results revealed significant correlations between pairs of PFAS compounds in all age groups, potentially leading to synergistic or cumulative health effects [6, 56]. To address this, we applied the widely used WQS and BKMR models to explore the joint effects of the six PFAS congeners on MetS and its components. However, neither WQS nor the BKMR models showed significant effects of PFAS mixtures on MetS across any age group. This may be due to the inconsistent associations between each PFAS congener and MetS, which could result in potential antagonistic effects when PFAS congeners are combined (Fig. S8). Interestingly, although no clear connections were found between individual PFAS congeners and hypertension in Modified Poisson regression models, significant positive associations were observed between PFAS mixtures and hypertension in middle-aged adults using the BKMR models. Co-exposure to PFAS mixture was also negatively correlated with low HDL-C in middle-aged adults, as revealed by both the WQS and BKMR models. Increased circulating cholesterol and sterol metabolites were also detected in mice following exposure to PFAS mixture, which included PFOA, PFOS, PFNA, and PFHxS [57]. These findings suggest that synergistic effects may occur with PFAS co-exposure.
The present study has several strengths. Firstly, it is the first to explore age-related heterogeneity in the associations between PFAS and MetS, using a national sample. The relatively large sample size and rigorous quality control during data collection enhance the credibility of our findings. Secondly, both WQS and BKMR models were used to explore the combined effects of six PFAS compounds on MetS and its components. Thirdly, we confirmed our results through various sensitivity analyses to ensure robustness. Admittedly, this is a cross-sectional study, which cannot establish a causal relationship between PFAS exposure and MetS. However, it provides important evidence for the potential metabolic dysregulation risks of PFAS exposure across different age groups. Further prospective studies and mechanistic investigations are required to better understand the metabolic impacts of PFAS exposure. In addition, even though we included as many potential confounding variables as possible, unknown factors may still induce residual confounding. PFAS may also interact with other chemicals, leading to additional confounding effects. Lastly, the evaluation of PFAS exposure relied on a single serum measurement, which may not accurately reflect the long-term health effects of PFAS exposure.
In summary, our study demonstrated heterogeneous associations between individual PFAS compounds and MetS across different age groups. Exposure to certain PFAS congeners was linked to dyslipidemia in young and middle-aged adults, characterized by elevated levels of TC, LDL-C, NHC, and HDL-C. Although PFAS mixture was not significantly correlated with the risk of MetS across all age groups, it induced a positive association with hypertension and negative correlations with low HDL-C and hypertriglyceridemia in middle-aged adults. These findings highlight the complex relationships between PFAS exposure and MetS, as well as its components, providing new insights into the health risks of PFAS exposure in humans. Additionally, greater attention should be given to age-specific PFAS exposure, particularly among younger people.
The datasets used for the current study are available in NHANES repository, https://wwwn.cdc.gov/nchs/nhanes/default.aspx. Data will be made available on request.
- PFAS:
-
Per-and polyfluoroalkyl substances
- MetS:
-
Metabolic syndrome
- NHANES:
-
National Health and Nutrition Examination Survey
- WQS:
-
Weighted quantile sum
- BKMR:
-
Bayesian kernel machine regression
- MeFOSAA:
-
2-(N-methyl-perfluorooctane sulfonamido) acetic acid
- PFDA:
-
Pefluorodecanoic acid
- PFHxS:
-
Perfluorohexanesulfonic acid
- PFNA:
-
Perfluorononanoic acid
- PFOA:
-
Perfluorooctanoic acid
- PFOS:
-
Perfluorooctanesulfonic acid
- LOD:
-
Limits of detection
- DR:
-
Detection rate
- TC:
-
Total cholesterol
- TG:
-
Triglyceride
- LDL-C:
-
Low-density lipoprotein cholesterol
- HDL-C:
-
High-density lipoprotein cholesterol
- NHC:
-
Non-high-density lipoprotein cholesterol
- HbA1c:
-
Glycohemoglobin
- HOMA-IR:
-
Homeostatic model assessment for insulin resistance
- BMI:
-
Body mass index
- PIR:
-
Poverty income ratio
- PR:
-
Prevalence ratio
- OR:
-
Odds ratio
- PIPs:
-
Posterior inclusion probability
- eGFR:
-
Estimated glomerular filtration rate
We thank the participants and staff members who contributed to the data collection and management of NHANES.
This study was supported by the Guangdong Basic and Applied Basic Research Foundation of China (2024A1515012547).
Not applicable.
Not applicable.
The authors declare no competing interests.
Springer Nature remains neutral with regard to jurisdictional claims in published maps and institutional affiliations.
Open Access This article is licensed under a Creative Commons Attribution-NonCommercial-NoDerivatives 4.0 International License, which permits any non-commercial use, sharing, distribution and reproduction in any medium or format, as long as you give appropriate credit to the original author(s) and the source, provide a link to the Creative Commons licence, and indicate if you modified the licensed material. You do not have permission under this licence to share adapted material derived from this article or parts of it. The images or other third party material in this article are included in the article’s Creative Commons licence, unless indicated otherwise in a credit line to the material. If material is not included in the article’s Creative Commons licence and your intended use is not permitted by statutory regulation or exceeds the permitted use, you will need to obtain permission directly from the copyright holder. To view a copy of this licence, visit http://creativecommons.org/licenses/by-nc-nd/4.0/.
Lin, L., Lin, X., Chang, S. et al. Age-specific associations between per- and polyfluoroalkyl substances exposure and metabolic syndrome: a cross-sectional study. Lipids Health Dis 24, 174 (2025). https://doi.org/10.1186/s12944-025-02582-x
