Lipids in Health and Disease volume 24, Article number: 73 (2025) Cite this article
Triglyceride glucose (TyG) index and atherogenic index of plasma (AIP) are indicators of insulin resistance. However, inadequate evidence indicates that the TyG index, AIP, and chronic pain are linked.
Data from the National Health and Nutrition Examination Survey (NHANES) between 1999 and 2004 were used. Directed acyclic graphs were used to identify 11 potential confounders. The TyG index and AIP were treated as continuous variables in the multivariate logistic regression models to assess their association with chronic pain. Furthermore, the nonlinear relationships between these indices and outcomes were investigated using restricted cubic spline plots. Subsequently, subgroup analyses were conducted for the sensitive populations. Receiver operating characteristic curves were used to compare the relationships between indices and outcomes. Ultimately, two sensitivity analyses were performed.
This study identified nonlinear associations between the TyG index, AIP, and chronic pain in 16,996,513 Americans. The odds ratio and 95% confidence interval for the TyG index (per 1 standard deviation increase) was 1.17 (1.02, 1.33), and for AIP (per 1 standard deviation increase) was 1.19 (1.07, 1.34). According to the subgroup analyses, the relationships between exposure and outcome were more pronounced in the non-diabetic population. The TyG index and AIP performed similarly in assessing chronic pain in ROC curves. Additionally, the results of the two sensitivity analyses matched the conclusions of the main study.
Nonlinear correlations between the TyG index, AIP, and chronic pain were identified among adults in the United States. This demonstrated that the TyG index and AIP displayed similar effectiveness in predicting the risk of chronic pain.
Chronic pain imposes a significant personal and socioeconomic burden on patients. The Centers for Disease Control and Prevention (CDC) estimated that 20.4% of American adults experienced chronic pain in 2016 [1]. A recent survey indicated that in America, chronic pain was still reported by 20.9% of individuals in 2021 [2]. This implies that chronic pain is becoming increasingly common. Various factors have been implicated in the etiology of chronic pain. These include genetics, socioeconomic position, lifestyle choices (smoking, alcohol consumption, daily activities, and healthy diet), and occupational characteristics [3,4,5,6]. Chronic pain should be conceptualized as a disease. Its goals include therapeutic aspects (continuing an active lifestyle despite pain) and psychological aspects (pain acceptance and setting objectives for positivity). Different types of pain cause different diagnoses and treatments: nociceptive pain, which results from tissue injury; neoplastic pain, which results from sensitization of the nervous system; and neuropathic pain, which results from nerve damage [7]. Treatments included medication, surgery, physiotherapy, and lifestyle therapy [7]. As proper pain management is an inherent human dignity and should be available in all healthcare systems, chronic pain warrants more attention as a global health concern [8].
The triglyceride glucose (TyG) index has recently gained recognition and has been extensively studied as a representative biomarker to assess insulin resistance (IR) [9, 10]. This index combines fasting plasma glucose (FPG) and triglyceride (TG) levels. IR is a critical mechanism underlying various metabolic diseases [11]. Tara M. Wallace et al. developed the homeostatic model assessment (HOMA) to evaluate β-cell function and IR by measuring fasting glucose, insulin, or C-peptide concentrations [12]. They indicated that, as the TyG index increased, there was a corresponding increase in the HOMA of IR [13]. The atherogenic index of plasma (AIP) is an effective indicator of metabolic syndrome (MetS), diabetes mellitus (DM), and cardiovascular diseases (CVDs) [14,15,16,17,18]. Elevated AIP levels were significantly linked to an elevated risk of diabetes-related mortality in individuals aged ≥ 65 years [19]. The general population’s mortality from all causes and AIP had a nonlinear relationship [19]. Elevated AIP levels had been linked to worsening of prehypertension in the Japanese population [20]. Furthermore, elevated AIP levels also had been linked to worsening of obstructive sleep apnea [21]. However, lack of research supports connections between the TyG index, AIP, and chronic pain, and it is currently unknown how they are related.
This study explored the potential connections between TyG and AIP and chronic pain using the National Health and Nutrition Examination Survey (NHANES) data. We aimed to elucidate the role of metabolic health, particularly IR, in chronic pain progression by examining these relationships. This research added to provide insight into at-risk populations and inform the development of targeted preventive measures.
This study used data from the NHANES, a research program assessing the health and nutritional status of adults and children in the United States. The NHANES uses a sophisticated multistage probability sampling design to select a sample representative of the population in the United States. All NHANES protocols were approved by the Research Ethics Review Board of the National Center for Health Statistics, and informed consent was obtained from each participant. NHANES data are available at https://www.cdc.gov/nchs/nhanes/ for public use.
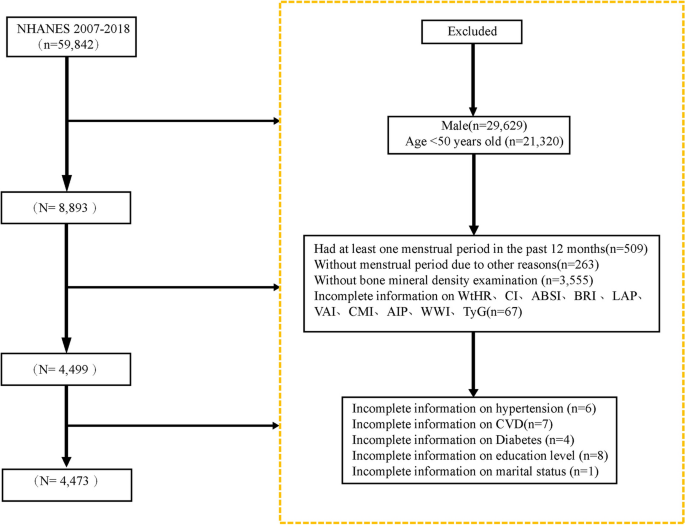
Participants from NHANES cycles between 1999 and 2004 were included in this analysis because these cycles offered comprehensive data on variables, including the TyG index, AIP, and chronic pain. Participants with missing data on relevant variables, such as smoking, were excluded to prevent potential confounding of results. The final analysis involved 4,895 eligible individuals from the NHANES (Fig. 1). Weighted methods were used for the data analysis to ensure that the study was nationally representative.

Flowchart for selecting study participants
In this study, exposure variables were TyG and AIP. TyG index was calculated using the following formula: ln [TG × FPG/2]. AIP was calculated using the following formula: log10 [TG/high-density lipoprotein cholesterol (HDL-C)].
Chronic pain was the outcome variable that was the focus of this study. People aged 20 years and above who completed the questionnaire had a component on various pains. MPQ100 (pain lasting > 24 h in the prior month) and MPQ110 (duration of pain) were used to characterize chronic pain. Participants were classified as having chronic pain if they had been experiencing pain for three months or more. However, those in the non-chronic pain category reported no pain in the month prior or experienced pain that subsided in less than three months.
Covariates in directed acyclic graphs (DAGs) encompassed sociodemographic characteristics (age, gender, ethnicity, education, and marital status), lifestyle factors (body mass index [BMI], alcohol use, and smoking), common diseases (DM, hypertension, and hyperlipidemia), and laboratory test data (low-density lipoprotein cholesterol [LDL-C]). The patient’s age was documented as continuous. The gender was classified as male or female. Ethnicity was categorized into four groups: Mexican, White, Black, and Other. Marital status was categorized as married (yes) or unmarried (no). Education levels were divided into four categories: less than ninth grade, ninth to eleventh grade, high school graduate or general educational development (GED) equivalent, and college graduate or above. LDL-C level was also considered a continuous variable. Weight (kg) was divided by height (m2) to calculate the BMI. Alcohol use was categorized as no or yes. Smoking was defined as non-smoking (no) or smoking (yes). DM, hypertension, and hyperlipidemia were categorized as non-diseased (no) or diseased (yes).
In this study, the minimal sufficient adjustments (MSAs) selected by DAGs [22, 23] included age, alcohol use, ethnicity, and gender (Fig. 2). Consequently, in addition to adjusting for the variables selected by DAGs, DM and hypertension were included as confounders in the model. By using this method, the estimated relationship between exposure and outcome was reduced in bias in the final model. Finally, the control variables for the models included age, gender, ethnicity, education, marital status, alcohol use, BMI, LDL-C, smoking, DM, hypertension, and hyperlipidemia (Figs. S1 and 2). The variables were described in detail in the supplemental materials and on the NHANES website.

Direct acyclic graphs illustrate the relationships between exposures, outcomes, and MSAs
In this study, the fasting subsample four-year MEC weight from 1999 to 2002 and the fasting subsample two-year MEC weight of subsequent years were used to combine the weights across survey cycles. Detailed information on the survey sample design and the methods to calculate weights are provided at https://wwwn.cdc.gov/nchs/nhanes/analyticguidelines.aspx.
Based on previous studies [24], continuous variables were presented as weighted mean ± standard deviation (SD), and categorical variables as weighted frequency and percentage. TyG and AIP were standardized to assess optimal effects using Z-score method. Differences in continuous variables between participants with and without chronic pain were evaluated using independent t-tests, while differences in categorical variables were evaluated using chi-square tests. Multivariate logistic regression was used to examine the relationships between the AIP, TyG index, and chronic pain. Model 1 was applied without any covariates. Age, gender, ethnicity, education, and marital status were incorporated into the formulation of Model 2. Based on Model 2, alcohol use, smoking, LDL-C, hypertension, BMI, DM, and hyperlipidemia were further adjusted in Model 3. The reports included odds ratios (OR) and 95% confidence intervals (CI). Based on Model 3, potential nonlinear correlations between exposure and outcome were assessed using restricted cubic spline (RCS) plots. Subgroup analyses were constructed, stratified by age (< 60/≥ 60 years), BMI (< 30/≥ 30), gender (male/female), hypertension (yes/no), and DM (yes/no). Model 1 did not account for any of these factors. Accordingly, three crucial demographic variables were adjusted in Model 2: ethnicity, education, and marital status. Then, all confounders were adjusted in Model 3. The TyG index and AIP demonstrated varying relationships with chronic pain across different subgroups. Receiver operating characteristic (ROC) curves were used to compare the associations between the index and outcomes. Ultimately, two sensitivity analyses were conducted: unweighted and weighted logistic regression, after excluding individuals with hyperlipidemia. R software (version 4.3.3) was used for all statistical analyses. Statistical significance was defined as a threshold of P-values < 0.05.
This research recruited 31,126 participants from NHANES from 1999 to 2004. Ultimately, 4,895 participants were statistically analyzed using a weighted method to represent the United States population comprehensively. Table 1 illustrated demographic information and other characteristics of the participants. The general demographics included 2,419 (51.24%) females, 2,575 (73.21%) whites, and 3,826 (75.71%) nonsmokers. Additionally, 2,087 patients had hypertension, and 573 had DM. The participants were grouped according to whether they had chronic pain, and their baseline characteristics were compared. Significant differences in chronic pain were observed according to education and ethnicity. Patients with chronic pain exhibited higher mean age, BMI, TyG index, and AIP values. Furthermore, box plots (Fig. 3) were drawn to compare the relationships between exposure and outcome in the unweighted original data. Plot analysis revealed that individuals with chronic pain exhibited elevated TyG index and AIP.

Box plots of the relationships between the TyG index, AIP, and chronic pain. A: The relationship between chronic pain and TyG in the original data. B: The relationship between chronic pain and AIP in the original data. Chronic pain was categorized as non-diseased (no) or diseased (yes)
Table 2 illustrated the findings of multivariate logistic regression that identified independent risk variables for chronic pain to deepen insight into the correlations among the TyG index, AIP, and chronic pain. Across all models, the results consistently displayed favorable relationships between TyG, AIP, and chronic pain.
TyG was used as an exposure variable, Model 1 exhibited a significant correlation. When some covariates were considered in Model 2, the connection was significant (OR, 1.26; 95% Cl, 1.14–1.40; P < 0.0001). The positive connection was steady in Model 3 (OR, 1.17; 95% Cl, 1.02–1.33; P = 0.023). This implied that the chance of chronic pain increased by 17% in the TyG index for every increase in SD.
When AIP was used as the exposure variable in Model 1, a significant association was observed between AIP and chronic pain (OR, 1.24; 95% CI, 1.12–1.36; P < 0.0001). Model 2 revealed a significant relationship (OR, 1.26; 95% Cl, 1.15–1.39; P < 0.0001). A steady positive correlation was maintained in Model 3 (OR, 1.19; 95% Cl, 1.07–1.34; P = 0.003). According to this result, every SD increase in AIP increased the risk of chronic pain by 19%. RCS plots based on models completely adjusted for variables were also used. It was revealed that the exposure was nonlinearly correlated with the outcome (P for nonlinearity < 0.05). In the RCS plot of the TyG index (Fig. 4A), the curve was divided into three segments by two inflection points (–0.68 and 0.03). When the TyG index was < − 0.68, the OR increased as the TyG index value increased. When − 0.68 < the TyG index was < 0.03, the OR decreased as TyG index values increased. When the TyG index was > 0.03, the overall trend of the curve increased. Similarly, in the RCS plot for AIP (Fig. 4B), the curve was divided into three segments by two inflection points (–0.38 and 0.50). When AIP < − 0.38, the OR increased as the AIP value increased. When − 0.38 < AIP < 0.50, the OR decreased as AIP values increased, and when AIP > 0.50, the overall trend of the curve exhibited an increase.

RCS depicts the associations between the TyG index, AIP, and chronic pain. In the TyG plot (A), the inflection points were − 0.68 and 0.03. In the AIP plot (B), the inflection points were − 0.38 and 0.50. Abbreviations: TyG-S, standardized triglyceride glucose index; AIP-S, standardized atherogenic index of plasma
ROC curves presented a maximum area under the curve (AUC) of 0.561 for TyG curves and 0.556 for AIP curves (Fig. S3). As a result, the prognostic efficacies of TyG and AIP were similar in diagnosing chronic pain.
Separate subgroup analyses were conducted to evaluate how TyG index, AIP, and chronic pain were related to various demographic groups. The TyG index and age interacted among individuals aged < 60 years (OR, 1.36; 95% CI, 1.20–1.53; P < 0.0001, P for interaction = 0.027; Fig. 5A). In the non-diabetic sample, the TyG index (OR, 1.32; 95% CI, 1.15–1.52; P < 0.001; P for interaction = 0.013; Fig. 5A) and AIP (OR, 1.25; 95% CI, 1.11–1.42; P < 0.001; P for interaction = 0.019; Fig. 5B) were significantly associated with chronic pain.

Forest plots for the associations between TyG index, AIP, and chronic pain. A: Subgroup analysis of the relationship between TyG index and chronic pain. B: Subgroup analysis of the relationship between AIP and chronic pain. *** indicates P < 0.0001; ** indicates P < 0.001; * indicates P < 0.05; Model 1: A crude model without adjustments. Model 2: A model adjusted for factors, including ethnicity, education, and marital status. Model 3: All confounders were adjusted. Abbreviations: DM, diabetes mellitus; BMI, body mass index
Similar to previous studies [25,26,27,28,29,30], three unweighted models were constructed in the sensitivity analyses (Table 3). The relationship between exposure and outcome remained stable. Additionally, participants with hyperlipidemia were excluded, and weighted logistic regressions were constructed, depicting that the relationships remained positive (Table 4). Accordingly, the analyses demonstrated that the relationships in these constructed models were stable.
The correlations among the TyG index, AIP, and chronic pain were demonstrated for the first time in this study. This observational study included 4,895 participants, and logistic regression analyses were conducted to explore the relationship between exposure and outcome. For each SD increase, the risk of chronic pain was higher by 17% for TyG (OR, 1.17; 95% CI, 1.02–1.33; P = 0.023) and 19% for AIP (OR, 1.19; 95% CI, 1.07–1.34; P = 0.003). The variability and specificity of study findings within each group were examined using extensive subgroup analyses. The results demonstrated exposure and outcome in the non-diabetic group were positively correlated. According to RCS plot results, TyG and AIP were independently observed to have a nonlinear link with the occurrence of chronic pain. The ROC plots showed that TyG and AIP had similar accuracies in assessing chronic pain.
Chronic pain disrupts daily life and significantly reduces quality of life [1]. Compared to men, women are more prone to have chronic pain [1, 31]. This result is consistent with our findings (Table 1). This difference may be influenced by sex hormones that affect pain sensitivity [32]. Moreover, women’s pain thresholds and tolerance vary with different stages of the menstrual cycle [32]. A recent study from Norway demonstrated that for each year, menopause is delayed, and the prevalence of chronic pain decreases by 1% [33]. Additionally, studies had shown that the brain networks linked to higher cognitive and reproductive processes and those controlled by estrogen share a great deal in common. These results point to a new connection between women’s endocrine aging and the upregulation of estrogen receptors in brain regions associated with cognitive function, including those related to emotion, memory, pain, stress response, and fine motor abilities [34, 35]. Besides, one or more of these causes trigger chronic pain [7]. Recent research has demonstrated a connection between pain and metabolic disorders. Chronic pain was also significantly correlated with CVD via stimulation of the sympathetic nervous system [36]. A Scottish cross-sectional investigation revealed a correlation between a higher incidence of MetS and chronic pain, especially high-intensity chronic pain [37]. Another case-control study demonstrated that MetS exacerbates pain in osteoarthritis [38].
Recent research has demonstrated a significant link between the risk of CVDs and the TyG index, a biomarker directly associated with metabolism. Research has further demonstrated an intense connection between TyG scores and the risk of heart failure [39]. This suggests that the TyG index may facilitate the pathogenesis of metabolic diseases and CVDs [40]. Additionally, the TyG index has been recommended as a convenient proxy indicator to measure IR, and its correlation with chronic pain may be due to several factors. First, IR causes inadequate vasodilation, resulting in peripheral vascular endothelial dysfunction. Nitric oxide deficiency is suggested to be a key factor linking IR to endothelial dysfunction [41]. Second, IR may significantly influence vascular remodeling, thinning, and side branching [42]. Furthermore, vascular endothelial growth factor levels exhibit a significant inverse relationship with IR [43]. Besides, several cytokines may contribute to chronic pain and IR. One of these cytokines is tumor necrosis factor-α (TNF-α) [44]. Current research demonstrates that TNF-α significantly affects neuropathic and inflammatory nociceptive hypersensitivity [45]. Hyperglycemia can also result from IR. Moreover, it increases the synthesis of advanced glycation end-products which can activate pro-inflammatory pathways and cause systemic inflammation [46].
AIP has recently emerged as a novel predictive biomarker of CVDs [47]. In a meta-analysis, elevated AIP levels are found to be an autonomous predictive determinant in individuals with coronary artery disease [48]. However, AIP is strongly associated with CVDs and may be linked to neurological disorders. According to Chen et al., higher AIP values are associated with reduced cortical structural volumes in middle-aged and older populations [49]. AIP, derived from TG and HDL-C, was observed in a cross-sectional study to reduce the incidence of chronic pain by 26% for every 20-unit increase in HDL-C level [50]. A Norwegian cross-sectional research found an inverse correlation between low back pain prevalence and HDL-C level [51]. Additionally, it revealed a positive correlation with TG [51]. Moreover, TG promotes the production of pro-inflammatory lipids and long-chain saturated fatty acids, triggering inflammatory activation in mononuclear macrophages [52]. Free fatty acids activate inflammatory vesicles and toll-like receptors (TLRs), particularly TLR-4, stimulating downstream inflammatory pathways [53]. Research has demonstrated that fat-rich diets increase immune cell proliferation in the central nervous system and that saturated fatty acids activate receptors on innate immune cells [54, 55]. Zhang et al. revealed that mice exhibited signs of MetS in a high-fat diet, such as elevated plasma cholesterol levels, relative to mice fed a control diet [56]. After an eight-week high-fat diet regimen, mice exhibited thermal nociceptive sensitization and mechanical allodynia in their hind paws. These painful behaviors were associated with higher densities of damaged epidermal nerve fibers in the hind paw skin. Concurrently, there was an elevation in the presence of inflammatory cells, including Langerhans cells and macrophages. Mice subjected to a high-fat diet received interleukin-10 injections to investigate the underlying mechanisms. This intervention ameliorated pain and attenuated the upregulation of pro-inflammatory cytokines [56]. High-fat feeding also exacerbates postoperative pain and delays wound healing after surgical incision [57]. Moreover, recent research has indicated an association between adipokines (adiponectin and leptin) and pain. Current evidence suggests that lipocalin concentration may increase during non-episodic periods and decrease during migraine attacks [58].
Dyslipidemia and IR induce oxidative stress, which is linked to various pain conditions [59]. Oxidative stress may contribute to the pain mechanisms in patients with fibromyalgia [60]. This factor may contribute to the pain experienced by individuals with hemophilia and is implicated in the modulation and regulation of oral pain [61, 62]. The interaction between IR, dyslipidemia, and oxidative stress induces a vicious cycle that may maintain and exacerbate chronic pain. Understanding these mechanisms underscores the importance of metabolic health in pain management and suggests potential therapeutic targets to prevent or alleviate chronic pain.
This study expands on the existing findings by elucidating the distinct associations between TyG and AIP with chronic pain in the general population. It suggests that metabolic health, as measured by these indices, may be a key in understanding the etiology of chronic pain.
The TyG index and AIP may be useful tools to evaluate the risk of chronic pain. These indices, readily available through routine blood tests, can be used to identify patients likely to experience chronic pain in primary care settings. The early identification of at-risk populations can facilitate the implementation of preventive measures. Implementing public health strategies to enhance metabolic health can significantly reduce chronic pain at the population level. These strategies may include initiatives to promote healthy diets, increase physical activity, and reduce obesity, all of which can improve metabolic indices. Besides, public health campaigns can raise awareness of the link between metabolic health and chronic pain, encouraging individuals to take proactive steps to optimize metabolic health and to potentially mitigate the risk of developing chronic pain.
This study benefited from several advantages of using the NHANES database. First, the comprehensive weighting system employed in the NHANES allows the findings to be generalizable to the overall United States population. Second, the standardized data collection and processing methodologies using NHANES data contributed to the reliability and consistency of the results, as these practices helped minimize potential biases in the data. Third, the NHANES database has a long data-collection period and a high frequency of updates. This database encompasses multiple disciplines, including epidemiology, public health, nutrition, and chronic disease management, making it suitable for various types of research. Therefore, the representativeness and standardization of the NHANES dataset make it the optimal choice for this study. Additionally, the study adhered to rigorous research practices using DAGs to identify relevant adjustment variables, thereby minimizing bias in the associations between exposure and outcome in the final model. Nonetheless, this study also has certain limitations. First, causal relationships cannot be inferred because they are observational studies. Further prospective studies are essential to accurately determine the correlations between TyG, AIP, and chronic pain. Despite thoroughly considering all relevant variables, unquantified confounding factors may still exist. Self-reports were used to assess chronic pain but may be subject to recall bias. Additionally, the AUC value of the ROC curve in this study is relatively low. This suggests a limited predictive performance of the exposure, which may have failed to capture the diversity and complexity of chronic pain adequately. Therefore, we will continue to explore the mechanisms underlying chronic pain and develop more accurate tools to predict chronic pain in the future.
In this study, TyG index and AIP exhibited nonlinear relationships with chronic pain prevalence. Furthermore, TyG and AIP predicted similar results for chronic pain among adults in the United States. A link was observed between an increased incidence of chronic pain and an increased TyG index and AIP, especially in non-diabetic individuals, where this tendency was more prominent. Nevertheless, prospective cohort studies are required to confirm these results. This study enhances our understanding of the association between metabolic health and chronic pain. This suggests that lifestyle changes that improve metabolic health could help reduce the burden of chronic pain.
Data is provided within the manuscript or supplementary information files.
- TyG:
-
Triglyceride glucose
- DAGs:
-
Directed acyclic graphs
- AIP:
-
Atherogenic index of plasma
- IR:
-
Insulin resistance
- NHANES:
-
National Health and Nutrition Examination Survey
- RCS:
-
Restricted cubic spline
- ROC:
-
Receiver operating characteristic
- TG:
-
Triglyceride
- CDC:
-
The Centers for Disease Control and Prevention
- HOMA:
-
The homeostatic model assessment
- MetS:
-
Metabolic syndrome
- AGEs:
-
Glycation end products
- HDL-C:
-
High-density lipoprotein cholesterol
- TLRs:
-
Toll-like receptors
- BMI:
-
Body mass index
- FPG:
-
Fasting plasma glucose
- DM:
-
Diabetes mellitus
- SD:
-
Standard deviation
- TNF-α:
-
Tumor necrosis factor-α
- OR:
-
Odds ratios
- CVDs:
-
Cardiovascular diseases
- CI:
-
Confidence intervals
- LDL-C:
-
Low-density lipoprotein cholesterol
- MSAs:
-
The minimal sufficient adjustments
- GED:
-
General educational development
- AUC:
-
Area under the curve
We would like to extend our sincere thanks to Jiajun Fu from Xiamen University for his invaluable assistance with the graphic design elements of this research. Then, we wish to express our appreciation to Yi Liu from Hefei Normal University for his unwavering support throughout this study. We thank Home for Researchers editorial team (www.home-for-researchers.com) for language editing service. Thanks to Zhang Jing (Second Department of Infectious Disease, Shanghai Fifth People’s Hospital, Fudan University) for his work on the NHANES database.His outstanding work, nhanesR package and webpage, makes it easier for us to explore NHANES database.
This work was supported by Heilongjiang Provincial Natural Science Foundation [SS2022H003] and Mudanjiang Medical University Graduate Advisor’s Special Research Plan [YJSZX2022036].
The protocol of NHANES has been approved by the Ethical Review Board of the National Center for Health Statistics, and the participants furnished written informed consent before participation.
We confirm that the manuscript has been read and approved for publication by all named authors.
The authors declare no competing interests.
Springer Nature remains neutral with regard to jurisdictional claims in published maps and institutional affiliations.
Below is the link to the electronic supplementary material.
Supplementary Material 1: Additional File 1: Fig. S1. DAG illustrates the relationship between the TyG index and chronic pain. Fig. S2. DAG demonstrates the relationship between AIP and chronic pain. Fig. S3. ROC curves of the TyG index and AIP to predict chronic pain.
Open Access This article is licensed under a Creative Commons Attribution-NonCommercial-NoDerivatives 4.0 International License, which permits any non-commercial use, sharing, distribution and reproduction in any medium or format, as long as you give appropriate credit to the original author(s) and the source, provide a link to the Creative Commons licence, and indicate if you modified the licensed material. You do not have permission under this licence to share adapted material derived from this article or parts of it. The images or other third party material in this article are included in the article’s Creative Commons licence, unless indicated otherwise in a credit line to the material. If material is not included in the article’s Creative Commons licence and your intended use is not permitted by statutory regulation or exceeds the permitted use, you will need to obtain permission directly from the copyright holder. To view a copy of this licence, visit http://creativecommons.org/licenses/by-nc-nd/4.0/.

Yan, Z., Zhang, H., Liu, S. et al. A cross-sectional study exploring relationships between triglyceride glucose index, atherogenic index of plasma, and chronic pain: NHANES 1999–2004. Lipids Health Dis 24, 73 (2025). https://doi.org/10.1186/s12944-025-02496-8
Received:
Accepted:
Published:
DOI: https://doi.org/10.1186/s12944-025-02496-8