The total return for American Express (NYSE:AXP) investors has risen faster than earnings growth over the last five years
When you buy a stock there is always a possibility that it could drop 100%. But on the bright side, you can make far more than 100% on a really good stock. One great example is (NYSE:AXP) which saw its share price drive 185% higher over five years. Unfortunately, though, the stock has dropped 4.9% over a week. But note that the broader market is down 0.6% since last week, and this may have impacted American Express' share price.
While this past week has detracted from the company's five-year return, let's look at the recent trends of the underlying business and see if the gains have been in alignment.
While markets are a powerful pricing mechanism, share prices reflect investor sentiment, not just underlying business performance. One way to examine how market sentiment has changed over time is to look at the interaction between a company's share price and its earnings per share (EPS).
Over half a decade, American Express managed to grow its earnings per share at 17% a year. This EPS growth is lower than the 23% average annual increase in the share price. So it's fair to assume the market has a higher opinion of the business than it did five years ago. And that's hardly shocking given the track record of growth.
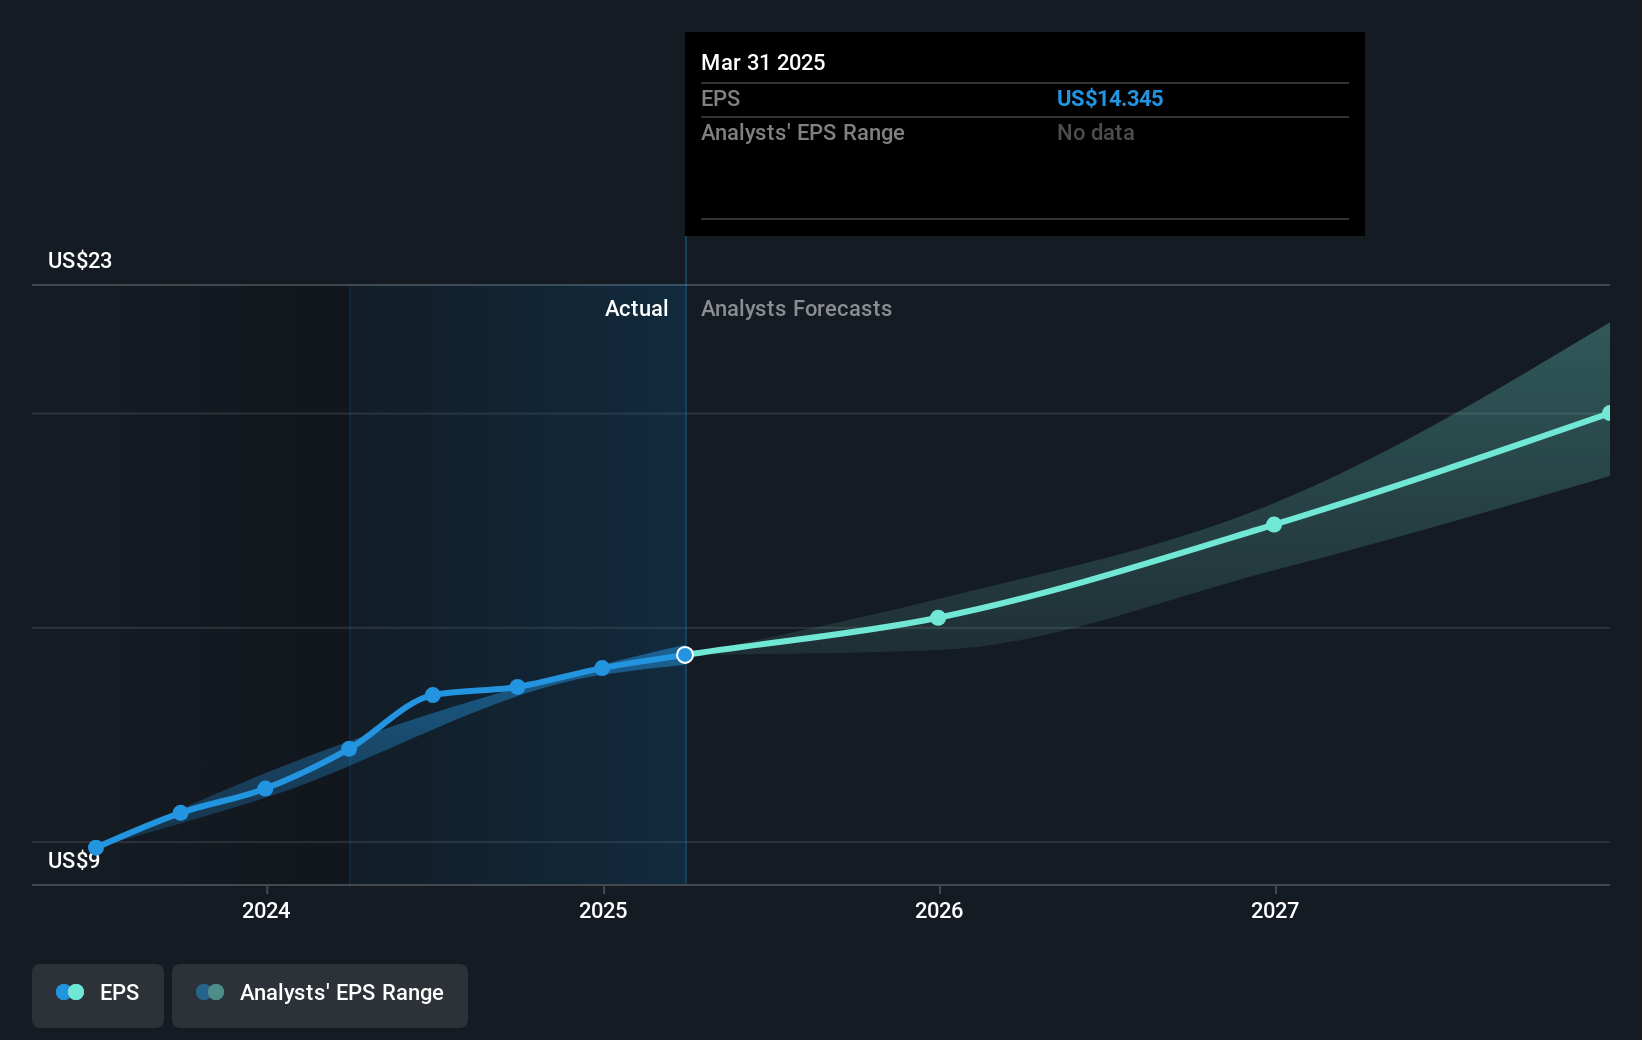
The company's earnings per share (over time) is depicted in the image below (click to see the exact numbers).
We consider it positive that insiders have made significant purchases in the last year. Having said that, most people consider earnings and revenue growth trends to be a more meaningful guide to the business. Dive deeper into the earnings by checking this interactive graph of American Express' earnings, revenue and cash flow.
As well as measuring the share price return, investors should also consider the total shareholder return (TSR). The TSR incorporates the value of any spin-offs or discounted capital raisings, along with any dividends, based on the assumption that the dividends are reinvested. So for companies that pay a generous dividend, the TSR is often a lot higher than the share price return. We note that for American Express the TSR over the last 5 years was 204%, which is better than the share price return mentioned above. This is largely a result of its dividend payments!
It's nice to see that American Express shareholders have received a total shareholder return of 29% over the last year. That's including the dividend. That gain is better than the annual TSR over five years, which is 25%. Therefore it seems like sentiment around the company has been positive lately. Someone with an optimistic perspective could view the recent improvement in TSR as indicating that the business itself is getting better with time. It's always interesting to track share price performance over the longer term. But to understand American Express better, we need to consider many other factors. Take risks, for example - American Express has we think you should be aware of.
American Express is not the only stock insiders are buying. So take a peek at this list of small cap companies at attractive valuations which insiders have been buying.
Please note, the market returns quoted in this article reflect the market weighted average returns of stocks that currently trade on American exchanges.
We've created the for stock investors,
• Connect an unlimited number of Portfolios and see your total in one currency
• Be alerted to new Warning Signs or Risks via email or mobile
• Track the Fair Value of your stocks
with us directly. Alternatively, email editorial-team (at) simplywallst.com.
This article by Simply Wall St is general in nature. We provide commentary based on historical data and analyst forecasts only using an unbiased methodology and our articles are not intended to be financial advice. It does not constitute a recommendation to buy or sell any stock, and does not take account of your objectives, or your financial situation. We aim to bring you long-term focused analysis driven by fundamental data. Note that our analysis may not factor in the latest price-sensitive company announcements or qualitative material. Simply Wall St has no position in any stocks mentioned.


:max_bytes(150000):strip_icc()/GettyImages-849834896-37075435532d44f782964c76045f17c7.jpg)