Cardiovascular Diabetology volume 24, Article number: 262 (2025) Cite this article
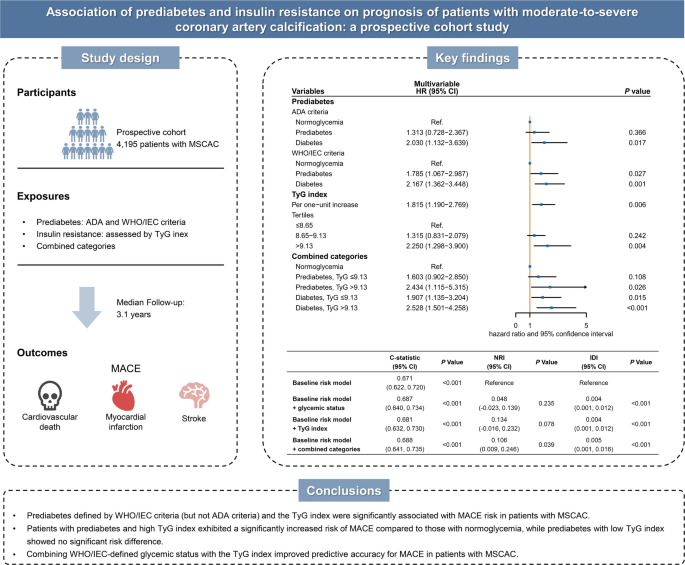
Prediabetes and insulin resistance are linked to the presence and progression of coronary artery calcification, but their prognostic significance in individuals with moderate-to-severe coronary artery calcification (MSCAC) remains unclear. The triglyceride–glucose (TyG) index, a validated surrogate marker of insulin resistance and a reliable predictor of cardiovascular outcomes, has not been thoroughly investigated for its role in risk stratification in patients with MSCAC. This study sought to evaluate the prognostic value of different prediabetes definitions and to determine whether the TyG index enhances risk stratification in this population.
This prospective cohort study consecutively enrolled 4195 patients with angiography-detected MSCAC. Prediabetes was defined using two criteria: the American Diabetes Association (ADA) criteria (fasting plasma glucose [FPG] 5.6–6.9 mmol/L and/or hemoglobin A1c [HbA1c] 5.7–6.4%), and the World Health Organization (WHO)/International Expert Committee (IEC) criteria (FPG 6.1–6.9 mmol/L and/or HbA1c 6.0–6.4%). The primary outcome was the incidence of major adverse cardiovascular events (MACE), including cardiovascular death, nonfatal myocardial infarction, and stroke.
The prevalence of ADA-defined prediabetes was 36.6%, nearly twice that of WHO/IEC-defined prediabetes (17.9%). Over a median follow-up of 3.1 years, WHO/IEC-defined prediabetes was significantly associated with an increased risk of MACE compared to normoglycemia (adjusted hazard ratio [HR] 1.79, 95% confidence interval [CI] 1.07–2.99), while ADA-defined prediabetes was not. Patients in the highest TyG index tertile had a significantly higher MACE risk than those in the lowest tertile (adjusted HR 2.25, 95% CI 1.30–3.90). Restricted cubic spline analysis demonstrated a positive linear association between the TyG index and MACE risk (P for nonlinearity > 0.05). Notably, individuals with both WHO/IEC-defined prediabetes and a high TyG index had an even higher MACE risk (adjusted HR 2.43, 95% CI 1.12–5.32), whereas those with prediabetes and a low TyG index did not demonstrate a comparable increase (adjusted HR 1.60, 95% CI 0.90–2.85). Incorporating both WHO/IEC-defined glycemic status and the TyG index into the baseline risk model significantly improved its predictive accuracy compared to including either marker alone, as indicated by enhancements in the C-statistic, continuous net reclassification improvement, and integrated discrimination improvement. These findings were consistent in subgroup analyses and sensitivity analyses.
This study highlights the prognostic value of WHO/IEC-defined prediabetes and the TyG index in identifying high-risk individuals among patients with MSCAC. Integrating these measures into clinical risk assessment may enhance prognostic accuracy and inform more targeted prevention strategies.
What is currently known about this topic?
What is the key research question?
What is new?
How might this study influence clinical practice?
Coronary artery disease (CAD), primarily driven by atherosclerosis, remains a leading global cause of morbidity and mortality [1]. Coronary artery calcification, a hallmark of advanced atherosclerosis, directly reflects the severity of CAD [2]. The prevalence of moderate-to-severe coronary artery calcification (MSCAC) is rising, affecting nearly one-third of individuals undergoing coronary angiography [3]. Moreover, individuals with MSCAC face more than twice the risk of mortality compared to those without it [2, 4]. Given this substantial clinical burden, early identification of high-risk patients through modifiable clinical parameters is critical for enabling timely interventions and improving clinical outcomes.
Prediabetes, an intermediate metabolic state between normoglycemia and type 2 diabetes, is projected to affect approximately one billion individuals worldwide by 2045 [5, 6]. A comprehensive meta-analysis of 129 studies found a significant association between prediabetes and increased risks of all-cause mortality and adverse cardiovascular events, particularly in individuals with atherosclerotic cardiovascular disease [7]. However, the prognostic implications of prediabetes vary across different cardiovascular diseases, potentially due to inconsistent diagnostic criteria in previous studies [8,9,10,11]. The American Diabetes Association (ADA) [12] and the World Health Organization (WHO)/International Expert Committee (IEC) [13] define prediabetes using distinct glycemic thresholds, potentially contributing to discrepancies in risk assessment. While previous studies have linked prediabetes to the presence and progression of coronary artery calcification, limited evidence exists regarding its prognostic value specifically in patients with MSCAC [14, 15]. Furthermore, individuals with prediabetes represent a heterogeneous population with diverse cardiovascular risk profiles, necessitating a refined approach to identify high-risk individuals and avoid unnecessary treatment in lower-risk patients.
Insulin resistance (IR), a predominant feature of prediabetes, is characterized by impaired insulin sensitivity and disrupted receptor signaling [5]. IR significantly contributes to atherosclerosis and adverse cardiovascular events [16]. Notably, differences in the severity of IR appear to influence cardiovascular risk among individuals with prediabetes, suggesting its potential role in risk stratification [17, 18]. The triglyceride-glucose (TyG) index, derived from fasting blood glucose (FBG) and triglyceride (TG) levels—two routinely available laboratory measures—has emerged as a simple and reliable surrogate marker for IR [19]. Compared with gold-standard assessments such as the hyperinsulinemic-euglycemic clamp (HEC) or surrogate indices like the Homeostasis Model Assessment of IR (HOMA-IR) and the quantitative insulin sensitivity check index (QUICKI) [20], the TyG index offers a more accessible alternative that does not require insulin assays or complex protocols. Numerous studies have confirmed a strong correlation between the TyG index and established IR metrics, with high sensitivity and specificity, supporting its clinical applicability [21]. Its effectiveness in risk stratification for individuals with prediabetes and cardiovascular conditions has been demonstrated across multiple studies [22,23,24]. Additionally, the TyG index has been independently associated with both the presence and progression of coronary artery calcification [25,26,27]. Despite these findings, its prognostic relevance in patients with MSCAC remains uninvestigated.
This study aimed to assess the prognostic value of prediabetes, defined by ADA and WHO/IEC criteria, within a large prospective cohort of patients with MSCAC. In addition, we sought to determine whether incorporating the TyG index could enhance risk stratification accuracy for these patients.
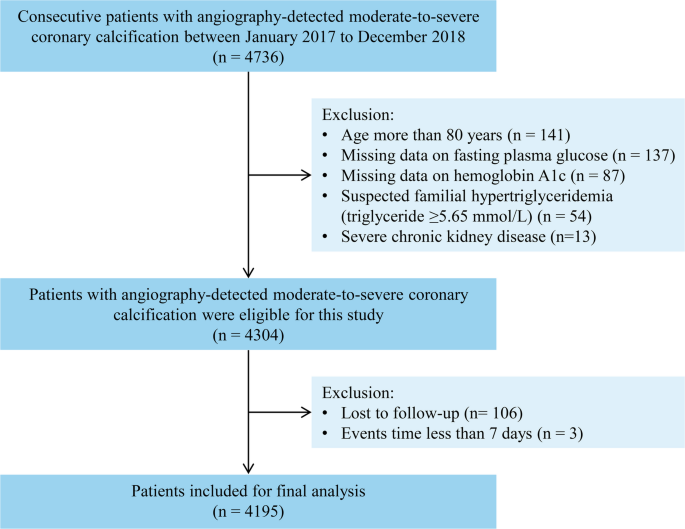
This prospective cohort study was conducted at Fuwai Hospital, National Center for Cardiovascular Diseases. The inclusion and exclusion criteria for participants are outlined in Fig. 1. Between January 2017 and December 2018, 4736 patients with angiography-detected MSCAC were consecutively recruited. The classification of MSCAC was based on standardized criteria established by Mintz et al. [28]. Specifically, moderate calcification was defined by the presence of radiopaque areas visible before contrast injection and partially extending into the target lesion during the cardiac cycle. Severe calcification was characterized by radiopaque regions visible prior to contrast administration and remained fixed throughout the cardiac cycle. Exclusion criteria were as follows: patients older than 80 years (n = 141); those with missing FBG data (n = 137) or HbA1c measurements (n = 87); suspected familial hypertriglyceridemia (TG ≥ 5.65 mmol/L, n = 54); and those with severe chronic kidney disease (estimated glomerular filtration rate [eGFR] < 30 ml/min/1.73 m2, n = 13). Additionally, patients who were lost to follow-up (n = 106) or who experienced major adverse cardiovascular events (MACE) within seven days of enrollment (n = 3) were excluded. In total, 4195 patients were included in the final analysis.
All medical procedures and treatments during hospitalization followed recommendations of contemporary guidelines and were administered at the discretion of the attending cardiologist. This study was conducted according to the ethical principles of the Declaration of Helsinki and received approval from the Institutional Review Board of Fuwai Hospital (2016-847). Each participant provided signed informed consent (version number AS2016‐1.1). Furthermore, the present study adhered to the Strengthening the Reporting of Observational Studies in Epidemiology guidelines to ensure methodological transparency and rigor.
Trained nurses conducted anthropometric assessments, including measurements of weight, height, and blood pressure, following standardized procedures. Body mass index (BMI) was calculated as weight in kilograms (kg) divided by height in meters squared (kg/m2). Medical history was recorded based on self-reports or physician-confirmed diagnoses. Before coronary angiography, fasting venous blood samples were collected from each participant. Biochemical analyses were performed in the hospital’s clinical chemistry laboratory using standardized methods. These measurements included high-density lipoprotein cholesterol (HDL-C), low-density lipoprotein cholesterol (LDL-C), TG, total cholesterol (TC), and FPG, all measured with an automated biochemical analyzer (Hitachi 7150, Tokyo, Japan). HbA1c levels were quantified using high-performance liquid chromatography (Tosoh G8 HPLC Analyzer; Tosoh Bioscience, Tokyo, Japan). Additional serum biomarkers were analyzed according to protocols established by the biochemistry laboratory at Fuwai Hospital. Renal function was evaluated using the Chronic Kidney Disease Epidemiology Collaboration (CKD-EPI) equation [29]. Information on demographics, clinical characteristics, laboratory values, and medication use was collected systematically using structured questionnaires administered by independent research staff.
Prediabetes was defined according to two widely recognized standards: the ADA criteria and the WHO/IEC criteria. The ADA defines prediabetes as an FPG level between 5.6 and 6.9 mmol/L and/or an HbA1c level between 5.7 and 6.4%, whereas the WHO/IEC set the thresholds at an FPG level of 6.1–6.9 mmol/L and/or an HbA1c level ranging from 6.0 to 6.4%. Diabetes was diagnosed based on a physician-confirmed medical history, self-reported history, current use of antidiabetic agents, or newly detected hyperglycemia at admission (defined as FPG ≥ 7.0 mmol/L or HbA1c ≥ 6.5%). Individuals with glucose measurements below the prediabetes thresholds for each definition criteria were considered normoglycemic.
Patients underwent follow-up assessments every six months until December 2021. Information on adverse events was obtained from electronic medical records, clinical visits, and structured telephone interviews conducted by independent personnel without access to patient-specific clinical information. To ensure accuracy and consistency, suspected clinical events were systematically reviewed following a standardized protocol, with detailed source documents gathered for verification. All reported events were independently reviewed by a panel of three experienced physicians who were not involved in patient recruitment or follow-up. In instances of disagreement among the reviewers, cases were re-examined, and final decisions were made by consensus.
The primary endpoint of this study was MACE, comprising cardiovascular death, nonfatal myocardial infarction, and nonfatal stroke. Each component of MACE was also analyzed separately as a secondary outcome. Deaths were attributed to cardiovascular causes unless a definitive non-cardiovascular cause was identified. Nonfatal myocardial infarction was diagnosed based on elevated cardiac troponin levels in conjunction with clinical symptoms, electrocardiographic abnormalities, angiographic or autopsy-confirmed intracoronary thrombus, or imaging findings consistent with myocardial injury. Stroke was defined as a localized neurological deficit lasting more than 24 h, confirmed by neuroimaging. For patients who experienced multiple events, only the first event was considered in the primary analysis.
Continuous variables were summarized as means with standard deviations or medians with interquartile ranges, based on their distribution. Categorical variables were expressed as counts and percentages. To compare continuous data, one-way analysis of variance (ANOVA) was applied when normality assumptions were met, while the Kruskal–Wallis H test was used otherwise. Categorical variables were assessed using the chi-square test or Fisher’s exact test when expected frequencies were low. Kaplan–Meier survival curves were generated to assess event-free survival with group differences evaluated using the log-rank test. The Cox proportional hazards model was used to estimate hazard ratios (HRs) with 95% confidence intervals (CIs), initially through univariate regression. Variables identified as significant in univariate analysis or considered clinically relevant were included in the multivariable Cox regression models. To ensure the stability and reliability of our model estimates, we followed the commonly recommended rule of at least 10 events per variable. The proportional hazards assumption was tested using Schoenfeld residuals. Multicollinearity among covariates was assessed by calculating variance inflation factors (VIFs); all VIFs were below 5, indicating no significant collinearity. To comprehensively evaluate the association between the TyG index and clinical outcomes, we analyzed the TyG index both as a continuous and a categorical variable (by tertiles). Restricted cubic spline models with four knots were applied to investigate possible non-linear associations between the TyG index and MACE, integrating the same adjustment variables as the multivariable Cox model. To assess its role in risk stratification, participants were divided into five groups according to glycemic status and TyG index levels: normoglycemia, prediabetes with low TyG, prediabetes with high TyG, diabetes with low TyG, and diabetes with high TyG. The upper tertile was designated as high TyG, whereas the lower two tertiles were grouped as low TyG levels. Interaction effects between glycemic status and the TyG index on the risk of MACE were also tested. To determine the incremental predictive value of adding glycemic status and the TyG index to the fully adjusted baseline risk model, the C-statistic, continuous net reclassification improvement (NRI), and integrated discrimination improvement (IDI) were computed. Subgroup analyses were conducted to examine potential effect modifiers, stratifying participants by age (< 65 vs. ≥ 65 years), sex (male vs. female), BMI (< 25 kg/m2 vs. ≥ 25 kg/m2), smoking status (yes vs. no), hypertension (yes vs. no), and clinical presentation (acute coronary syndrome [ACS] vs. chronic coronary syndrome). Interaction terms were used to test for statistical differences between subgroups. All statistical assessments were two-tailed, with P values < 0.05 considered statistically significant. Analyses were conducted using SPSS (version 23.0, IBM Corp, Armonk, NY, USA) and R software (version 3.6.1, R Foundation for Statistical Computing, Vienna, Austria).
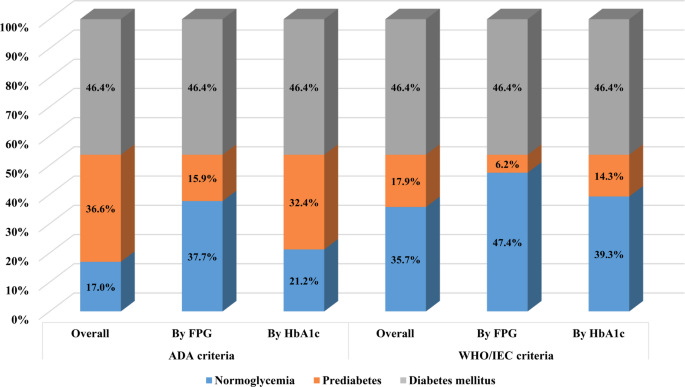
Figure 2 presents the classification of patients according to different glycemic criteria. Among the 4195 patients with MSCAC, 1536 (36.6%) were categorized as prediabetes based on the ADA criteria. Of these, 665 (15.9%) were identified using the FPG threshold, while 1359 (32.4%) met the criteria based on HbA1c levels. When using the WHO/IEC definition, 750 (17.9%) were classified as prediabetic, with 258 (6.2%) meeting the FPG criteria and 599 (14.3%) identified through HbA1c measurements.
Percentage of patients with different glycemic status according to the American Diabetes Association criteria and the World Health Organization/International Expert Committee criteria. ADA, American Diabetes Association; FPG, fasting plasma glucose; HbA1c, hemoglobin A1c; IEC, International Expert Committee; WHO, World Health Organization
Table 1 summarizes the demographic and clinical characteristics of participants based on WHO/IEC-defined glycemic status. The overall mean age was 61.3 ± 9.6 years, with the prediabetes group having the highest average age among the three groups. Compared to those with impaired glucose metabolism, normoglycemic individuals were more often male and exhibited higher HDL-C levels. Across glycemic categories, there was a progressive trend in the prevalence of hypertension, prior stroke or myocardial infarction, and the use of angiotensin-converting enzyme inhibitors or angiotensin receptor blockers, beta-blockers, and calcium channel blockers. Additionally, participants with diabetes demonstrated higher BMI, heart rate, and TG levels, along with lower left ventricular ejection fraction (LVEF), compared to normoglycemic and prediabetic groups. Baseline characteristics based on the ADA criteria are summarized in Supplementary Table 1.
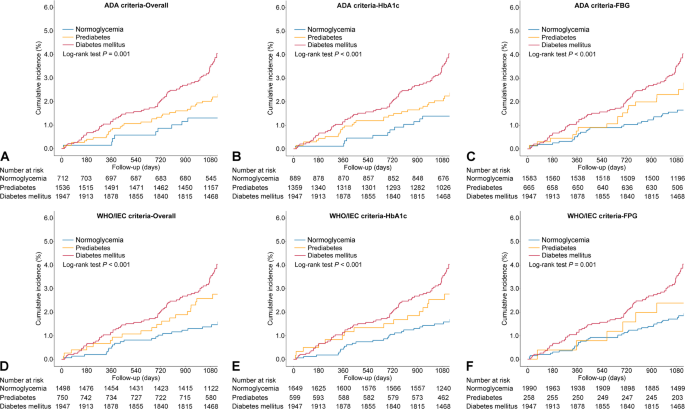
Over a median follow-up period of 3.1 years (interquartile range: 3.0–3.3 years), 166 MACEs were documented, including 52 cardiovascular deaths, 94 non-fatal myocardial infarctions, and 30 non-fatal strokes. According to ADA-based categories, MACE incidence was 2.1% in normoglycemic individuals, 2.9% in those with prediabetes, and 5.5% in diabetes cases. When applying WHO/IEC definitions, the corresponding rates were 1.9%, 4.0%, and 5.5%, respectively (Table 2). The incidence of MACE demonstrated an increasing trend across glycemic groups, independent of classification criteria (Fig. 3). Table 2 summarizes the association between prediabetes and MACE risk under different definitions. Variables that were either statistically significant in univariate analysis or clinically relevant were included in the multivariable Cox regression models, including age, sex, BMI, systolic blood pressure, smoking status, prior myocardial infarction, prior stroke, LVEF, eGFR, ACS at presentation, levels of LDL-C, HDL-C, TG, and the use of statins or oral hypoglycemic agents (Supplementary Table 2). Based on ADA criteria, no statistically significant difference in MACE risk was found between prediabetic and normoglycemic groups in either unadjusted and adjusted Cox regression models (both P > 0.05), regardless of whether prediabetes was defined by FPG alone or HbA1c alone. Conversely, prediabetes defined by WHO/IEC criteria was significantly associated with an increased MACE risk compared to normoglycemia (adjusted HR: 1.79; 95% CI 1.07–2.99). Further stratification revealed that WHO/IEC-defined prediabetes based on HbA1c was significantly associated with increased MACE risk, whereas the FPG-based definition was not (Table 2).
Kaplan–Meier curves for major adverse cardiovascular event for patients with different glycemic status according to A ADA criteria, B ADA HbA1c criteria, C ADA FPG criteria, D WHO/IEC criteria, E WHO/IEC HbA1c criteria, and F WHO/IEC FPG criteria. American Diabetes Association; FPG, fasting plasma glucose; HbA1c, hemoglobin A1c; IEC, International Expert Committee; WHO, World Health Organization
For secondary outcomes, WHO/IEC-defined prediabetes was independently associated with increased risks of cardiovascular death and myocardial infarction, whereas this association was not observed with ADA-defined prediabetes (Supplementary Tables 3–4, Figs. 1–2). In contrast, the risk of non-fatal stroke did not differ significantly between prediabetic and normoglycemic groups, regardless of the classification criteria used (Supplementary Table 5 and Supplementary Fig. 3).
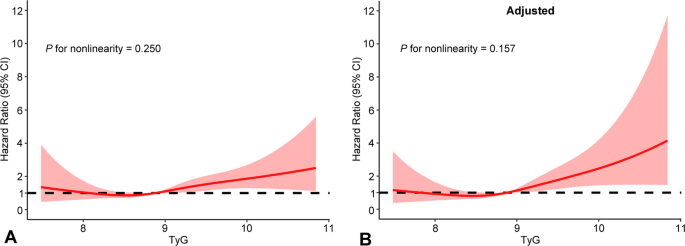
The median TyG index was 8.9 (interquartile range: 8.5–9.3). Baseline characteristics stratified by TyG tertiles (≤ 8.65, 8.65–9.13, and > 9.13) are detailed in Supplementary Table 6. Kaplan–Meier analysis demonstrated a higher risk of MACE in individuals within the highest TyG tertile relative to the lower group (log-rank test P = 0.001; Supplementary Fig. 4). As a categorical variable, the highest TyG tertile was independently associated with increased MACE risk compared to the lowest tertile (adjusted HR 2.25, 95% CI 1.30–3.90; Table 3). When analyzed as a continuous variable, the TyG index also remained an independent predictor of MACE in the fully adjusted model (Table 3). Restricted cubic spline curves indicated that the TyG index was positively linearly correlated with the risk of MACE (P for nonlinearity > 0.05; Fig. 4). Regarding secondary endpoints, an elevated TyG index was significantly associated with a higher risk of myocardial infarction (when analyzed as a categorical variable) and stroke (when analyzed as a continuous variable) (Supplementary Table 7, Supplementary Fig. 4).
Restricted cubic splines of the relationship between the triglyceride-glucose index and major adverse cardiovascular events. A Unadjusted model; B adjusted model. CI, confidence interval; TyG, triglyceride-glucose
To further investigate how the TyG index contributes to cardiovascular risk stratification, participants were divided into five groups based on WHO/IEC-defined glycemic status and TyG levels: normoglycemia, prediabetes with low TyG, prediabetes with high TyG, diabetes with low TyG, and diabetes with high TyG (Fig. 5). This threshold was chosen based on results from multivariable Cox models and restricted cubic spline analysis. In addition, such categorical grouping allows for more precise risk stratification and clearer visual representation, which is crucial for clinical decision-making and practical implementation. MACE incidence rates were 1.9% (normoglycemia), 3.5% (prediabetes with low TyG), 5.4% (prediabetes with high TyG), 5.0% (diabetes with low TyG), and 6.0% (diabetes with high TyG). Compared to the normoglycemic group, individuals with prediabetes and high TyG had a significantly higher MACE risk (adjusted HR: 2.43; 95% CI 1.12–5.32), whereas those with prediabetes and low TyG did not (adjusted HR 1.60; 95% CI 0.90–2.85) (Fig. 5). Similar findings were observed for myocardial infarction risk, but no significant differences were noted for cardiovascular death or non-fatal stroke among the five groups (Supplementary Table 8). No significant interaction was identified between glycemic status and the TyG index for MACE risk (P for interaction = 0.641).
Univariate (A) and multivariable (B) Cox regression models for major adverse cardiovascular events according to different glycemic status based on the World Health Organization/International Expert Committee criteria and triglyceride-glucose index levels. CI, confidence interval; HR, hazard ratio; TyG, triglyceride-glucose
The added predictive value of incorporating glycemic status, TyG index, and their combined classification into a baseline risk model is presented in Table 4. The C-statistic for the Cox model with baseline risk factors was 0.671 (95% CI 0.622–0.720) for MACE. Adding glycemic status (WHO/IEC-based) or the TyG index separately led to marginal improvements (C-statistic: 0.687 and 0.681, respectively). while combining both further improved performance (C-statistic of 0.688; 95% CI 0.641–0.735). NRI and IDI analyses confirmed these enhancements, with an NRI of 0.106 (95% CI 0.009–0.246, P = 0.039) and an IDI of 0.005 (95% CI 0.001–0.016, P < 0.001).
We conducted interaction analyses to explore whether the relationship between glycemic status (WHO/IEC-based) and TyG index varied across different subgroups (Supplementary Table 9). No significant effect modifications were observed for age, sex, BMI, smoking status, hypertension, or clinical presentation (all P for interaction > 0.05). Sensitivity analyses using ADA-based glycemic categories showed similar trends: prediabetes with high TyG was consistently associated with increased MACE risk, while prediabetes with low TyG was not (Supplementary Fig. 5).
This study was the first to evaluate the prognostic impact of different prediabetes definitions in a large, prospective cohort of patients with MSCAC and to explore the role of the TyG index in risk stratification for these patients. Our findings demonstrated that individuals with prediabetes exhibited an unfavorable cardiovascular profile, irrespective of the classification criteria used. However, only prediabetes defined by WHO/IEC criteria remained significantly associated with an increased risk of MACE after adjusting for confounding variables. Moreover, the TyG index demonstrated a consistent association with MACE risk, whether assessed as a continuous or categorical variable. Notably, individuals with prediabetes and a high TyG index exhibited a significantly higher risk of MACE compared to those with normoglycemia, while prediabetes with low a TyG index was not significantly associated with increased risk. These results highlight the importance of using WHO/IEC criteria to define prediabetes and incorporating the TyG index as a measure of IR to optimize risk stratification in patients with MSCAC.
Increasing evidence has explored the association between prediabetes and adverse cardiovascular events in atherosclerotic cardiovascular disease, revealing considerable variability in the prognostic impact of prediabetes depending on the definition used and the clinical endpoints assessed [30, 31]. For example, Nigam et al. found that WHO/IEC-defined prediabetes was associated with a higher risk of all-cause and cardiovascular mortality in patients with CAD [32]. In contrast, Jin et al. reported no significant difference in cardiovascular death, nonfatal myocardial infarction, or stroke between ADA-defined prediabetes and normoglycemia [9]. Our study builds upon these findings by demonstrating that only WHO/IEC-defined prediabetes, not ADA-defined prediabetes, was significantly associated with an increased risk of MACE in patients with MSCAC. These results are consistent with previous studies investigating the role of prediabetes in patients with stable CAD [33]. The discrepancy between WHO/IEC and ADA definitions may be attributed to the higher thresholds for HbA1c and FPG set by WHO/IEC criteria, which potentially identify individuals at greater cardiovascular risk [12, 13]. Our findings also suggest that HbA1c is more effective than FPG in identifying patients at risk for MACE, as it offers a more stable measure of long-term glycemic control, while FPG is more susceptible to daily fluctuations [13]. Compared to normoglycemic individuals, those with prediabetes are exposed to chronic hyperglycemia, which promotes the development and progression of coronary atherosclerosis, thereby increasing the risk of cardiovascular events [34, 35], These processes are primarily driven by mechanisms involving systemic inflammation, endothelial dysfunction, and oxidative stress [5, 30]. Overall, our findings support the use of WHO/IEC-defined prediabetes for more precise risk assessment in patients with MSCAC.
Importantly, prediabetes represents a heterogeneous metabolic state, with cardiovascular risk varying considerably depending on individual comorbidities and metabolic profiles [36]. This variability highlights the need for precise and comprehensive risk assessment to avoid underestimating risk in high-risk individuals and overtreating those at low risk. For example, a prospective cohort study demonstrated that the presence of hypertension significantly increased the risk of adverse events in patients with CAD and prediabetes, whereas prediabetes alone was not associated with a significantly worse prognosis[37]. Similarly, a multicenter study identified lipoprotein(a) [Lp(a)] as a critical modifier in patients with CAD and prediabetes: only those with elevated Lp(a) levels experienced significantly increased cardiovascular risk [9]. These findings highlight the need to identify high-risk subgroups within the prediabetes population and to refine cardiovascular risk stratification accordingly.
The TyG index is a well-established marker of IR with high sensitivity and specificity [38]. It has consistently demonstrated its independent predictive value for adverse cardiovascular outcomes across various conditions, including CAD, heart failure, atrial fibrillation, hypertension, and cerebrovascular disease [39, 40]. Notably, a long-term study in patients with type 2 diabetes (≥ 15 years of follow-up) showed that the TyG index is a useful predictor of all-cause mortality and MACE [41]. These findings highlight the TyG index’s relevance for primary and secondary cardiovascular risk prevention. Given that coronary artery calcification is a hallmark of advanced atherosclerosis and a strong predictor of cardiovascular events, understanding how the TyG index relates to calcification burden is critical. Coronary artery calcification is driven by multiple pathophysiological processes, with IR playing a key role [42, 43]. Previous studies have demonstrated a significant relationship between IR (assessed by HOMA-IR or TyG index) and coronary artery calcification [44, 45]. Further evidence suggests that IR independently predicts calcification progression regardless of baseline severity [26]. In our study, we identified for the first time a significant association between the TyG index and MACE risk in patients with MSCAC. These findings expand our understanding of the TyG index as a valuable tool for risk stratification in cardiovascular disease.
Furthermore, in our study, we identified that the TyG index significantly improved the risk stratification of MACE in patients with MSCAC and prediabetes. These results align with prior research indication that the TyG index is an important predictor of cardiovascular and all-cause mortality, CAD severity, and cardiovascular risk in individuals with prediabetes [22,23,24]. For example, Santulli et al. indicated that IR (evaluated by the TyG index) and prediabetes play substantial roles in the development of cognitive and physical impairments, highlighting their importance in managing hypertension [46]. Collectively, these findings support the potential of the TyG index for cardiovascular risk assessment in this high-risk population. Given the observational design, causality cannot be inferred. Nonetheless, these associations may be driven by the variability in IR severity among individuals with prediabetes [17, 18, 47]. More severe IR is linked to an elevated risk of cardiovascular diseases and adverse events, possibly mediated by endothelial dysfunction, metabolic dysregulation, oxidative stress, and chronic inflammation [48]. These findings emphasize the need for special attention to individuals with prediabetes and a high TyG index, as they are at substantially increased cardiovascular risk. Further studies are needed to validate these findings in larger populations and inform optimal intervention strategies.
This study offers novel insights into the role of WHO/IEC-defined prediabetes and the TyG index in cardiovascular risk assessment among patients with MSCAC. However, certain limitations should be noted. First, as a prospective observational study, residual confounding remains possible despite adjustments for multiple covariates. For instance, data on lipid-lowering therapies (such as fibrates), which could influence triglyceride levels and the TyG index, were unavailable and may have introduced unmeasured confounding. Furthermore, the potential impact of hepatitis C virus infection, which has been linked to IR, prediabetes, and cardiovascular risk, was not assessed in this study [49]. Second, although MACE was comprehensively evaluated as the main outcome, the study was not sufficiently powered to analyze individual events separately. Future large-scale studies with longer follow-ups are necessary to confirm these findings. Additionally, the absence of oral glucose tolerance test (OGTT) data precluded the classification of prediabetes based on impaired glucose tolerance, which may have led to some misclassification. Nonetheless, OGTT is less commonly used than FPG or HbA1c for routine screening due to its complexity. Finally, because the study population was drawn exclusively from a single-center East Asian cohort, the findings may not be generalizable to other ethnic groups. Future multi-center studies in more diverse populations with long-term follow-up are needed to verify these observations and to assess the clinical implications of interventions targeting prediabetes and IR in patients with MSCAC.
In patients with MSCAC, our findings highlighted the prognostic value of WHO/IEC-defined prediabetes. The TyG index emerged as a valuable predictor of MACE, further refining risk stratification in individuals with prediabetes. These findings emphasize the importance of incorporating WHO/IEC-defined prediabetes and TyG-based IR assessment to better identify high-risk patients with MSCAC.
No datasets were generated or analysed during the current study.
- ACS:
-
Acute coronary syndrome
- ADA:
-
American Diabetes Association
- BMI:
-
Body mass index
- CAD:
-
Coronary artery disease
- CI:
-
Confidence interval
- eGFR:
-
Estimated glomerular filtration rate
- FPG:
-
Fasting plasma glucose
- HbA1c:
-
Hemoglobin A1c
- HDL-C:
-
High-density lipoprotein cholesterol
- HR:
-
Hazard ratio
- IDI:
-
Integrated discrimination improvement
- IEC:
-
International Expert Committee
- IR:
-
Insulin resistance
- LDL-C:
-
Low-density lipoprotein cholesterol
- LVEF:
-
Left ventricular ejection fraction
- MACE:
-
Major adverse cardiovascular events
- MSCAC:
-
Moderate-to-severe coronary artery calcification
- NRI:
-
Net reclassification improvement
- OGTT:
-
Oral glucose tolerance test
- TC:
-
Total cholesterol
- TG:
-
Triglyceride
- TyG:
-
Triglyceride–glucose
- WHO:
-
World Health Organization
The authors are grateful to the participants and all research personnel involved.
This study was supported by the CAMS Innovation Fund for Medical Sciences (CIFMS) (2021-I2M-1-008), Noncommunicable Chronic Diseases-National Science and Technology Major Project (2023ZD0513900), and the Fundamental Research Funds for the Central Universities (3332024033).
This study was conducted under the Declaration of Helsinki and received approval from the Institutional Review Board of Fuwai Hospital (2016-847). All participants provided written informed consent before participation.
Not applicable.
The authors declare no competing interests.
Springer Nature remains neutral with regard to jurisdictional claims in published maps and institutional affiliations.
Supplementary Material 1: Figure S1. Kaplan–Meier curves for cardiovascular death for patients with different glycemic status according to A ADA criteria, B ADA HbA1c criteria, C ADA FPG criteria, D WHO/IEC criteria, E WHO/IEC HbA1c criteria, and F WHO/IEC FPG criteria. American Diabetes Association; FPG, fasting plasma glucose; HbA1c, hemoglobin A1c; IEC, International Expert Committee; WHO, World Health Organization.
Supplementary Material 2: Figure S2. Kaplan–Meier curves for myocardial infarction for patients with different glycemic status according to A ADA criteria, B ADA HbA1c criteria, C ADA FPG criteria, D WHO/IEC criteria, E WHO/IEC HbA1c criteria, and F WHO/IEC FPG criteria. American Diabetes Association; FPG, fasting plasma glucose; HbA1c, hemoglobin A1c; IEC, International Expert Committee; WHO, World Health Organization.
Supplementary Material 3: Figure S3. Kaplan–Meier curves for stroke for patients with different glycemic status according to A ADA criteria, B ADA HbA1c criteria, C ADA FPG criteria, D WHO/IEC criteria, E WHO/IEC HbA1c criteria, and F WHO/IEC FPG criteria. American Diabetes Association; FPG, fasting plasma glucose; HbA1c, hemoglobin A1c; IEC, International Expert Committee; WHO, World Health Organization.
Supplementary Material 4: Figure S4. Kaplan–Meier curves for A major adverse cardiovascular event, B cardiovascular death, C myocardial infarction, and D stroke according to tertiles of the triglyceride-glucose index.
Supplementary Material 5: Figure S5. Univariate (A) and multivariable (B) Cox regression models for major adverse cardiovascular events according to different glycemic status based on the American Diabetes Association criteria and triglyceride-glucose index levels. CI, confidence interval; HR, hazard ratio; TyG, triglyceride-glucose.
Open Access This article is licensed under a Creative Commons Attribution-NonCommercial-NoDerivatives 4.0 International License, which permits any non-commercial use, sharing, distribution and reproduction in any medium or format, as long as you give appropriate credit to the original author(s) and the source, provide a link to the Creative Commons licence, and indicate if you modified the licensed material. You do not have permission under this licence to share adapted material derived from this article or parts of it. The images or other third party material in this article are included in the article’s Creative Commons licence, unless indicated otherwise in a credit line to the material. If material is not included in the article’s Creative Commons licence and your intended use is not permitted by statutory regulation or exceeds the permitted use, you will need to obtain permission directly from the copyright holder. To view a copy of this licence, visit http://creativecommons.org/licenses/by-nc-nd/4.0/.
Xie, E., Cai, H., Ye, Z. et al. Association of prediabetes and insulin resistance on prognosis of patients with moderate-to-severe coronary artery calcification: a prospective cohort study. Cardiovasc Diabetol 24, 262 (2025). https://doi.org/10.1186/s12933-025-02807-4
Received:
Accepted:
Published:
DOI: https://doi.org/10.1186/s12933-025-02807-4
