BMC Health Services Research volume 25, Article number: 927 (2025) Cite this article
This study examines the relationship between opioid use disorder (OUD) and healthcare use, especially regarding length of stay, total charges, and costs in U.S. hospitals from 2005 to 2020.
We used the Healthcare Cost & Utilization Projects (HCUP) National Inpatient Sample (NIS) data to compare these outcomes between patients with and without OUD. We applied generalized linear modeling (GLM) with gamma distribution and log link to assess the effect of OUD on the three outcomes.
Our results show that hospital stays for patients with OUD were significantly longer, while total charges and costs were lower than those without OUD. Over time, there was a tendency towards convergence between total charges and costs for OUD and non-OUD patients. The study also revealed that the severity of illness was strongly related to length of stay, total charge, and total cost, and OUD patients with greater illness severity and comorbid conditions demonstrated increased outcomes compared to those without OUD, with increased total costs and charges in 2020.
Our results offer important insights into the healthcare impact of OUD. Future studies should use patient-level data to better understand the overall healthcare use per person rather than per hospital stay, as well as more recent years of data to study greater Covid-19 specific impacts.
The study emphasizes the need for more efforts to decrease the prevalence of OUD in the U.S. to help ease the pressure on the healthcare system. It also demonstrates the potential influence of the severity of illness and comorbidity on healthcare use, suggesting a need for specific interventions for patients with severe conditions.
One of the most severe and persistent challenges facing public health in the United States is the opioid epidemic, which has claimed the lives of tens of thousands of people every year since the late 1990 s [1]. The National Institute on Drug Abuse reports that in 2021, drug overdoses killed more than 106,000 people in the U.S., and opioids were involved in three out of four of those deaths [1]. Opioid use disorder (OUD) is a chronic condition that affects millions of Americans who misuse prescription or illicit opioids, such as heroin [2]. OUD was initially defined to capture heroin use [3], but the types of opioids that lead to OUD have changed over time. About 2.7 million people in the U.S. have OUD, and more than two-thirds of them started with prescription opioids [4, 5]. OUD has enormous social and economic impacts, costing the U.S. more than a trillion dollars in 2017 due to lost lives, reduced quality of life, and lower productivity [6].
OUD is a chronic disorder characterized by persistent opioid craving, inability to control or reduce opioid use, and continued use despite negative physical or mental health consequences [7]. Opioid use, whether prescribed or illicit, is associated with increased healthcare utilization and cost [8, 9]. Compared to people without OUD, people with OUD have higher per-patient healthcare expenditures, averaging more than $10,000 annually [10]. They also incur 33% higher costs per emergency department (ED) visit and 8% higher cost per inpatient visit than non-OUD patients [11]. One of the main drivers of these costs is the increased risk of serious bacterial infections among people who use opioids. These infections require long-term intravenous antibiotic therapy and often result in hospitalization [12]. People with OUD are more likely to develop these infections than those without OUD and tend to have longer hospital stays but lower daily charges [13, 14]. In addition to the direct health effects of opioid use, people with OUD often suffer from co-occurring mental health disorders, such as depression (36.1%), PTSD (18.1%), and bipolar disorder (8.7%). These disorders can exacerbate the severity and complexity of OUD and increase the need for mental health services [15].
The Covid-19 pandemic had a major impact on healthcare utilization in the U.S. According to a recent study, healthcare utilization decreased by about one-third, with median value reductions of 42% in visits and 28% in admissions [16]. One of the reasons for this decline was that 21% of American adults postponed or avoided seeking medical care due to Covid-19 concerns [17]. However, not all groups were equally affected by the pandemic. Patients with OUD did not have a higher risk of contracting Covid-19 [18], but they faced more severe outcomes for those with it. Compared to Covid-19 patients without OUD, they had higher risk of hospitalization (40%), intubation (105%), kidney failure (51%), sepsis (130%) and death (110%) [19]. They also stayed longer in the hospital, averaging 16% more days than non-OUD patients [20]. While there is no national data on how OUD patients used hospital services for non-Covid-19 reasons during the pandemic, a local study in Los Angeles found that three safety net hospitals experienced a significant increase in OUD patient visits for OUD treatment [21].
The rising rates of OUD continue to pose a challenge for healthcare providers and policymakers. Many legislative actions have been taken to address the increasing OUD and opioid overdose mortality rates, but their effectiveness has been limited [22]. To improve the outcomes of patients with OUD, some organizations, such as the Substance Abuse and Mental Health Services Administration (SAMHSA), have proposed to expand and modify the OUD treatment programs [23]. However, the potential impact of these proposals on OUD and opioid overdose rates is uncertain. Therefore, it is important to understand how patients with OUD use hospital services and what factors influence their healthcare utilization. This study aims to compare hospital utilization between patients with and without OUD and to identify the key determinants of healthcare utilization among patients with OUD. This information can help design more effective interventions and allocate resources more efficiently to address this complex issue.
This study examines the healthcare utilization and costs of patients with OUD from 2005 to 2020, and the factors that affect their length of stay in hospitals. Previous studies on this topic focused on specific health complications related to OUD rather than the overall population of OUD patients [14, 24, 25]. Moreover, no study has used the Healthcare Cost and Utilization Project (HCUP) National Inpatient Sample (NIS) data to analyze the changes in healthcare utilization and costs during the Covid-19 pandemic, which has significantly changed the delivery of healthcare services [26]. This study aims to understand the healthcare utilization and costs of OUD patients compared to non-OUD patients, along with possible effects due to Covid-19, by modeling (1) length of stay, (2) total charges, and (3) total costs. We hypothesized that OUD patients will have higher adjusted values for all three metrics than non-OUD patients.
In the U.S. hospital system, it is important to distinguish between total charges and total costs. Charges represent what hospitals bill for services, which are often inflated relative to actual payments. Costs, by contrast, reflect the estimated actual resources consumed in delivering care, calculated using cost-to-charge ratios. Analyzing both outcomes allows us to examine hospital financial practices (via charges) and true resource use (via costs). This dual perspective provides insight into potential disparities in billing versus service intensity, and improves comparability for international audiences who may be unfamiliar with the U.S. system.
The study employs a trend analysis using serially captured, retrospective, data from the HCUP NIS from the years 2005 to 2020. First released in 1988, HCUP NIS is the largest publicly available all-payer inpatient healthcare database in the U.S. and is designed to create national estimates of inpatient healthcare utilization, quality, and outcomes. The NIS is sampled from the State Inpatient Databases (SID) and collects discharge-level hospital visits from U.S. community hospitals. Each year contains around 7 million hospital stays and, when weighted, can estimate around 35 million hospitalizations [27]. As the study involved secondary analysis of de-identified data from HCUP, it was deemed exempt from IRB review under U.S. federal regulations (45 CFR 46.104(d)(4)), and no ethics approval was required.
Our sample consisted of hospitalizations for those 18 and above as well as for those with primary expected payers not inclusive of “no charge.” The total sample size for each year ranged from 32,355,827 to 39,885,120 weighted individual discharge data points totaling 593,062,708 weighted discharges across the time period. The percent of total missing data across all relevant variables varied across the years from around 10% to upwards of 40%. To determine the optimal means of handling missing data, we prepared the data under three different scenarios and modeled results for comparison. First, data were fully imputed via hot deck imputation [28,29,30,31,32,33] (Supplemental Table 1.A-1.C). Second, data were restricted to include only hospitalizations with available outcomes and missing categories were created for race (between 2% and 26% missing across years) and income quartile (around 3% missing across years): the two cofactors with the largest percent of missing data (Supplemental Table 2.A-2.C). Third, data were restricted to complete cases, or only hospitalizations with data available for every variable used in analysis (Supplemental Table 3.A-3.C). For overall cohort restrictions as well as individual restrictions under each scenario, subpopulation analyses were conducted to account for excluded data. Based off the model results for the three scenarios (Supplemental Table 4), estimates were not statistically different, thus we used the first, fully imputed scenario for our main analysis to maximize power.
Dependent variables
We analyzed three outcome variables related to healthcare utilization: length of stay, total cost, and total charge. These variables were either count or continuous measures. The length of stay variable was the difference between each patient’s admission and discharge dates, as calculated by HCUP. If one of these dates was missing, HCUP used the supplied length of stay. Length of stay values ranged from 0 to 365 days, with 0 indicating same-day discharges and 365 indicating stays longer than a year. Patients who stayed longer than a year were truncated to 365 due to inadequate data covering beyond a year. The total charge was the amount that the hospital billed the patient for a given hospital stay, rounded to the nearest dollar. The total charge values spanned from $25 to $10 million, with extreme values being flagged as inconsistent by HCUP and treated as missing. The inconsistency thresholds varied by year, reflecting the inflation of costs over time. Total charge values mostly did not include professional fees or non-covered charges, and HCUP adjusted them accordingly if they did. Total cost was the amount the hospital paid for a given stay. The Cost-to-Charge ratio (CCR) files from HCUP help estimate the total cost of hospital visits based on the total charge. These files match each hospital visit in the HCUP NIS data with its corresponding CCR by hospital identifier. The CCR is derived from cost and charge data in the hospital cost reports from the Healthcare Cost Report Information System (HCRIS) of the Centers for Medicare & Medicaid Services [34]. The total cost varies from $7 to $5,589,638. Most hospital visits are short and have low charges and costs, while a few are long and have high charges and costs. This creates a right-skewed distribution for length of stay, total charge, and total cost.
Independent variables
The main independent variable is OUD diagnosis, which indicates if the patient had OUD during the hospital visit. We used International Classification of Diseases, Ninth Revision (ICD-9) and ICD, Tenth Revision (ICD-10) codes to identify OUD diagnosis, as our data spanned from 2005 to 2020. The switch from ICD-9 to ICD-10 happened in the fourth quarter of 2015. We checked variables DX1– DX30 for 2005–2015 (Q3) and I10_DX1– I10_DX40 for 2015 (Q4)−2020 to find the relevant ICD codes for each hospital stay. Patients with any OUD-related code were labeled “Yes” for OUD diagnosis. See Supplemental Table 5 for the complete list of codes.
We also controlled for these demographic variables: age, sex, race/ethnicity, income, primary expected payer, weekend admission day, rural or urban hospital location, discharge quarter, region of hospital, and bed size of the hospital. Age is a numeric variable based on the admission age. The other demographic factors are categorical variables. We used median income by zip code as a proxy for individual income, with four income groups: $1–24,999, $25,000–34,999, $35,000–44,999, and $45,000+. The primary expected payer has four categories: Medicare, Medicaid, Private, and self-pay/other. We excluded those with No Charge as the payer, as we are interested in patients who fall under standard payment categories. Hospital bed size has three categories: Small, medium, and large. The number of beds for each category depends on the region and the rural or urban status of the hospital.
Confounding risk factors
To account for other factors that could affect the outcome, we adjusted for death during hospitalization, number of procedures, diagnoses, and severity. We used the discharge status to indicate whether the patient died or survived in the hospital. We classified the patients into two groups based on whether they had two or more procedures or less than two. Similarly, we divided the patients into two groups based on whether they had five or more diagnoses or less than five. We followed the methodology of Alemu et al., 2021 to determine these cutoffs [35]. We measured severity using the severity of illness and risk of mortality scores of the All Patient Defined Diagnosis Related Group. We grouped severity into five levels according to the degree of functional impairment: None, minor, moderate, major, and extreme.
All analyses accounted for the complex survey design of HCUP NIS. Descriptive statistics were calculated to describe the sample characteristics for 2005, 2013, and 2020, stratified by OUD status. We reported median and inter-quartile range (IQR) for continuous variables, and frequencies and percentages for categorical variables. The Wilcoxon Rank Sum test was used to compare OUD and non-OUD groups for non-normally distributed continuous variables, and Chi-Squared tests for categorical variables. We also plotted the unadjusted median outcomes with 95% confidence intervals (CIs) over the years to examine the trends before adjusting for possible confounders. Diagnostic tests (goodness-of-fit via residuals, influential observations, predictive ability) were conducted in order to select the best model for analyzing adjusted associations. Based upon these tests, we used generalized linear models (GLM) with a gamma distribution and log link to analyze the association between OUD and three outcomes: length of stay, total charge, and total cost. Each outcome was modeled separately with OUD and other adjusted variables as covariates/cofactors. For each model, we estimated coefficients and 95% CIs for each year from 2005 to 2020 to assess the temporal changes in the relationship between OUD and the outcome. For ease of interpretation, we exponentiated the coefficients from the GLM models, so the results represent the percentage change in length of stay, total charge, or total cost when a predictor variable changes from the reference group to a non-reference group. For the continuous variable age, estimates represent the percentage change in outcomes for a 10-year increase in age, which was used rather than a one-year increase to ensure the CIs were different than the estimates after rounding.
As a supplemental analysis, OUD and non-OUD encounters were balanced on all previously mentioned characteristics via propensity score inverse probability of treatment weighting (IPTW). Additionally, OUD was treated as similarly used in main analysis (OUD in any diagnosis position vs. no OUD across all positions) as well as broken up into diagnosis positions (no OUD, OUD in diagnosis position 1–4, OUD in diagnosis position 5+) to further tease out OUD severity/comorbidity associations with outcomes. Median outcomes and 95% CIs were reported. We set the significance level at 5% for all hypothesis tests. We used SAS 9.4 (Cary, North Carolina, USA) for all demographic analysis and R version 4.0.2 (R Foundation for Statistical Computing) for generalized linear modelling.
We analyzed data from 2005 to 2020, and results showed that encounters with OUD diagnosis were more often males than females in all years, although the gender gap narrowed over time (from 57.66% male in 2005 to 52.83% male in 2020). Medicaid was the most common insurance type among OUD patients in 2005 through 2020 (42.51–45.01%), while Medicare was the most prevalent among non-OUD patients (around 45.84–47.03%). OUD patient encounters also had a higher proportion of illness severity, with moderate loss of function (respenting the largest chunk of encounters by severity classes) being elevated across years of study (OUD vs. non-OUD 2005 to 2020: 54.24% vs. 40.41–39.97% vs. 36.91%). Additionally, major loss of function (OUD vs. non-OUD 2005 to 2020: 17.89% vs. 19.85–26.38% vs. 26.39%) and extreme loss of function (OUD vs. non-OUD 2005 to 2020: 4.28% vs. 4.89–14.72% vs. 11.84%) increased in OUD patients across years of study, with levels being similar for major loss of function and OUD levels being higher than non-OUD by 2020 (Supplemental Table 6). Moreover, OUD patients had a longer median length of stay (3.28, 3.14, and 3.36 days) than non-OUD patients (2.67, 2.62, and 2.71 days) in 2005, 2013, and 2020 respectively, with significant differences (p <.0001). However, non-OUD patients had higher median total charge and total cost than OUD patients in all years until 2019 where the differences became insignificant (Table 1).
The difference in unadjusted median length of stay between discharges with and without OUD diagnosis remains relatively stable over time (Fig. 1). Discharges with an OUD diagnosis have a median length of stay of about 3-3.5 days, while discharges without an OUD diagnosis have a median length of stay of about 2.4 days. From 2010 onwards, there was a slight increase in median length of stay for OUD patients, but not for non-OUD patients. The confidence intervals of the length of stay are clearly separated in all years. Unadjusted median total charges and total cost between discharges with and without OUD diagnosis both converge over time (Figs. 2 and 3). Both measures show a significant increase over time for both groups, but non-OUD patients have higher median total charges and total cost than OUD patients. In 2019 and onwards, differences between total cost and total charge of OUD is insignificant. The gap between the two groups is largest for total charges at around $5,000, and around $2,000 for total cost, with each decreasing to no difference over time.
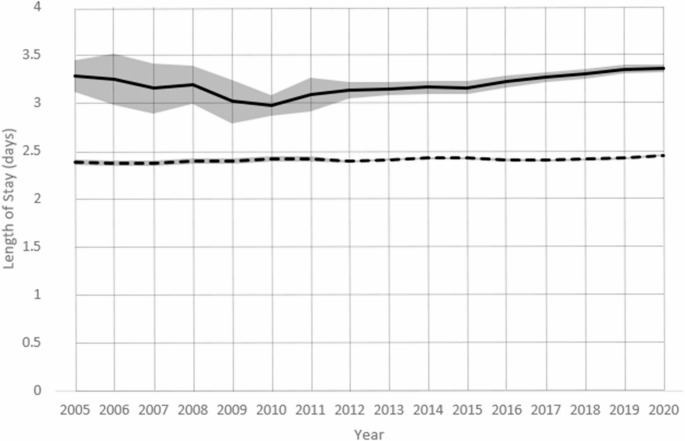
Unadjusted median length of stay by OUD with 95% CIs for years 2005–2020 *Solid Line = OUD, Dashed Line = non-OUD
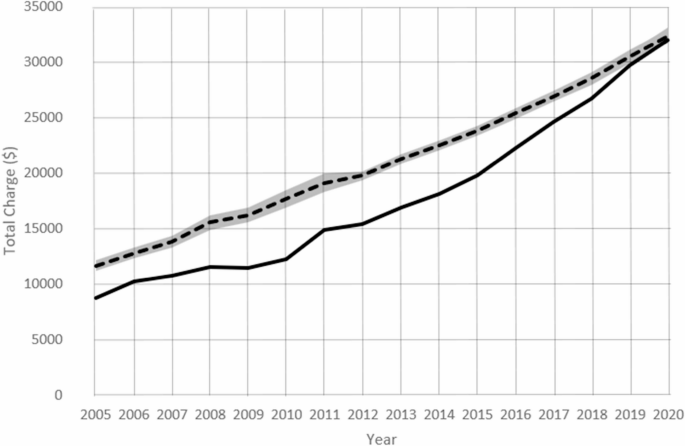
Unadjusted median total charge by OUD with 95% CIs for years 2005–2020 *Solid Line = OUD, Dashed Line = non-OUD
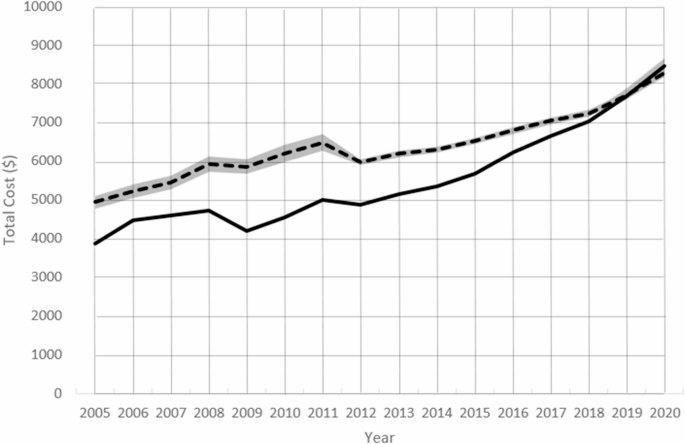
Unadjusted median total cost by OUD with 95% CIs for years 2005–2020 *Solid Line = OUD, Dashed Line = non-OUD
After adjusting for demographic and risk factors, patients diagnosed with OUD had longer hospital stays than those without OUD from 2005 to 2020. The adjusted model length of stay estimate (95% CI) for OUD patients was 1.212 (1.48–1.280) in 2005, 1.234 (1.209–1.259) in 2013, and 1.192 (1.176–1.207) in 2020, indicating that OUD patients stayed 21%, 23%, and 19% longer than non-OUD patients in respective years (Table 2, Supplemental Table 1.A). The difference in length of stay between OUD and non-OUD patients varied slightly over time, but did not show a clear trend (Fig. 4).
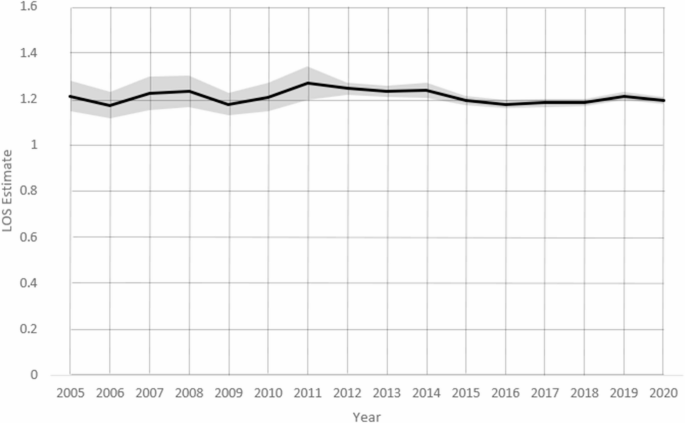
Model estimates of Length of Stay of OUD vs. Non-OUD for years 2005–2020 *Fit via generalized linear models (GLM) with a gamma distribution and log link
Compared to hospital stays for patients not diagnosed with OUD, hospital stays where the patient had an OUD diagnosis had lower total charges in 2005 and 2013: 19% lower in 2005 (Est [95% CI]: 0.809 [0.765–0.855], P <.0001) and 11% lower in 2013 (Est [95% CI]: 0.890 [0.869–0.911], P <.0001). No difference was found in 2020 (Est [95% CI]: 0.991 [0.973–1.009], P =.3091) (Table 2, Supplemental Table 1.B). Although hospitalizations for non-OUD patients have largely had significantly lower total charges than for OUD patients in previous years, those differences have diminished over time. By 2019 and 2020, no differences were found (Fig. 5).
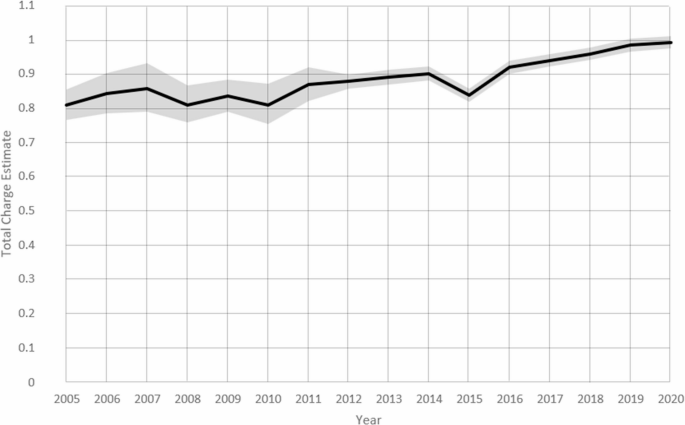
Model estimates of Total Charge of OUD vs. Non-OUD for years 2005–2020 *Fit via generalized linear models (GLM) with a gamma distribution and log link
Similar to total charge, the total cost of hospital stays for patients with OUD diagnosis was significantly lower than those without OUD diagnosis in 2005 and 2013. However, the gap between the two groups narrowed over time and eventually disappeared in 2020, from 18% lower in 2005 (Est: 0.817 [0.778–0.859], P <.0001) to 8% lower in 2013 (Est: 0.922 [0.899–0.945], P <.0001) and finally no different in 2020 (Est: 1.013 [0.998–1.028], P =.0989) (Table 2, Supplemental Table 1.C). The total cost trend over time was similar to the total charge trend, showing convergence between OUD and non-OUD patients (Fig. 6).
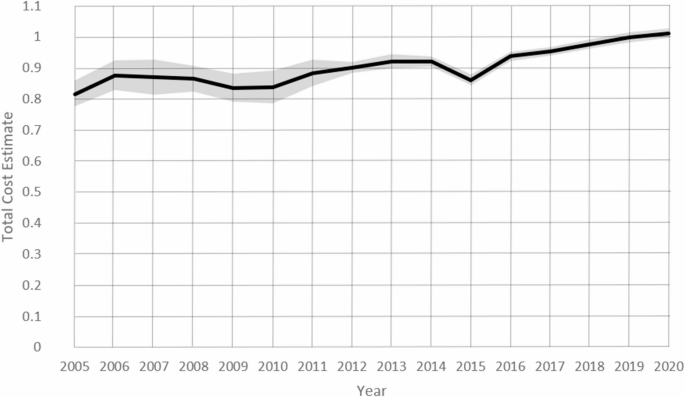
Model estimates of Total Cost of OUD vs. Non-OUD for years 2005–2020 *Fit via generalized linear models (GLM) with a gamma distribution and log link
The severity of illness was also strongly associated with all outcomes (length of stay, total charge, and total cost). Patients who had an extreme loss of function, compared to those with minor loss of function, had between 2.4 to nearly 4 times higher outcomes across all years of study (Supplemental Table 3.A-C). Supplemental Table 7 displays results from the supplemental IPTW analysis. For overall OUD, those with OUD had lower total charges and costs in 2005 yet these differences diminished by 2020, with OUD being slightly (non-significantly) elevated. When differentiating by OUD diagnosis position, compared to those without OUD, those with OUD in position 1–4 had consistently lower total charges and costs from 2005 to 2020 (non-significant), however, those with OUD in position 5 + had consistently higher total charges and costs with charges (median $ [95% CI]: 41,830 [40,673 − 42,987] vs. 36,691 [36,011–37,371]) and costs (median $ [95% CI]: 11,092 [10,843 − 11,341] vs. 9,338 [9,221-9,454]) both being significantly higher in 2020. Length of stay was significantly higher for those with OUD, and those with OUD in positions 1–4 and 5+, compared to those without OUD across all years.
We used HCUP NIS data from 2005 to 2020 to analyze how OUD affects hospital length of stay, total charges, and total cost. We found that discharges with OUD diagnosis stayed longer in the hospital across all years of study, but had lower charges and costs than discharges without OUD diagnosis, while these effects diminished over time. Our results on length of stay are similar to those of other studies that examined hospital visits for OUD-related conditions [14]. However, our total charges and costs results differ from those of studies focusing on emergency department visits for OUD patients [11]. This may reflect the variation in costs between ED and hospital settings. Medicare is the most common payer for inpatient encounters within the HCUP database, and within Premier PINC AI Healthcare Databases [11, 36], which differs from the national data that shows most U.S. residents have private health insurance [37]. As this study utilized HCUP NIS, the majority of encounters involving Medicare beneficiaries (Supplemental Table 8) is well understood. Further, our study found that non-OUD encounters involved older patients and substantially higher percentages of Medicare beneficiaries than OUD encounters, while OUD encounters had higher percentages of Medicaid beneficiaries. Medicare recipients are known to utilize more inpatient hospital services than other insurance groups [38, 39], likely incurring higher costs and thus explaining our findings. As far as reductions in charge/cost outcomes between OUD/non-OUD groups over time, it is also important to note that the proportion of Medicare beneficiaries who are non-elderly persons with disabilities has increased over time. As of 2016, they represent about 16% of the total Medicare population, up from 12% in 1995 [40, 41]. This group experiences high levels of chronic pain relative to either the traditional Medicare population or the commercially insured. The increase in the proportion of non-elderly persons with disabilities among Medicare beneficiaries may have implications for the prevalence and management of OUD within this population and hence their utilization of the health care system. In our study, OUD encounters with Medicare increased from 17.2% in 2005 to 30.5% in 2020. Additionally, higher severity scores were shown consistently to have the highest associations with outcomes, while also noting that discharges with OUD diagnosis also had higher severity scores than discharges without OUD diagnosis (especially in more recent years), which is consistent with previous studies that reported worse health outcomes and mortality for OUD patients [42].
To examine the relationship between OUD diagnosis and length of stay, we compared the expected length of stays for discharges with and without OUD diagnosis from 2005 to 2020. Our results confirmed previous studies that showed longer lengths of stay for patients with OUD diagnosis than those without OUD diagnosis [14, 35, 43, 44]. However, we also observed some variation and fluctuation in the difference in length of stays between the two groups over time, which made it challenging to identify a clear trend. Finally, we did not find evidence that Covid-19 had a differential impact on the length of stay for patients with or without OUD diagnosis, as the estimate for the length of stay in 2020 was similar to most years since 2016.
We examined the relationship between OUD diagnosis and two outcomes: total charge to the patient and total cost to the hospital. We found that discharges with OUD diagnosis have lower costs/charges than discharges without OUD. This contradicts some studies that reported higher costs/charges for OUD patients with certain diseases, such as acute pancreatitis and diverticulitis [45, 46]. However, it is consistent with other studies that found no significant difference in total charges for OUD and non-OUD patients with infections [14]. We also observed that the adjusted estimates of total charges and total costs decreased over time, with both outcomes converging for OUD and non-OUD patients by 2020. This suggests an equalization of costs/charges between the two groups over time. Additionally, in supplemental analyses, when considering the diagnosis position of OUD, although those with OUD in position 1–4 had lower total cost and charge outcomes than those without OUD, those with OUD in position 5 + actually had higher total cost and charge outcomes than those without OUD which became significant in 2020. Those with OUD in position 5 + by definition were required to have at least four higher ranked conditions, largely involving co-occurring conditions. OUD patients with comorbid conditions are known to be a higher-risk group [47, 48], and require more healthcare services than OUD patients alone [49]. In addition, healthcare spending and costs increased in 2020 largely driven due to Covid-19 [50, 51], along with Covid-19 adversely impacting patients with SUDs, especially those with comorbid conditions, likely requiring more healthcare support. Availability and affordability of treatment both were decreased which additionally adversely impacted patients with SUDs [52, 53], further exacerbating conditions and requiring more intensive treatment. All of these factors likely explained our findings, but further studies teasing out other factors (e.g., healthcare engagement, treatment intensity, reimbursement policies, coding practices, more in depth social determinants of health, etc.) could assist in more effectively pinpointing the underlying mechanisms.
While prior literature often reports higher healthcare utilization and costs for individuals with OUD, our results show that OUD patients had lower total charges and costs per hospitalization compared to non-OUD patients, particularly in earlier years. This contrast can also be explained by differences in study design. Many prior studies use patient-level, longitudinal data, capturing cumulative or annual healthcare expenditures, often in emergency department or outpatient settings where OUD patients have frequent, acute visits and long-term care needs [54,55,56]. In contrast, our study examines visit-level inpatient data, which may capture hospitalizations of lower complexity or different reimbursement patterns, particularly when OUD is not the primary diagnosis. Supplemental analyses support this by showing that patients with OUD listed in diagnosis positions 1–4 (i.e., OUD as a more central reason for admission) had lower per-visit costs, while those with OUD in positions 5+ (suggesting more complex, comorbid profiles) incurred higher costs; especially in 2020. These findings suggest that while individuals with OUD may impose a high cumulative burden on the healthcare system, the cost intensity of any given hospitalization can be lower and is strongly influenced by diagnostic context. Our study thus offers a hospital-specific, diagnosis-aware lens that complements existing literature and highlights the value of nuanced analysis in understanding OUD-related healthcare utilization.
Our findings reveal substantial disparities in the length of stay, total charge, and total cost of hospital visits for patients with and without OUD. Patients with OUD, especially co-occurring or severe conditions, have higher healthcare utilization because they are more prone to develop serious health complications [8, 9, 42]. These disparities raise questions about the implications of OUD for hospital capacity and efficiency. The longer stay for patients with OUD could limit the availability of beds for other patients. Moreover, the higher frequency of hospital visits for patients with OUD, as observed in emergency departments [57], could increase their overall healthcare burden regardless of the length or cost of each visit. Our findings and previous studies on this topic suggest that reducing the prevalence of OUD in the U.S. would benefit the healthcare system.
This study has some limitations that should be acknowledged. The NIS data only captures hospital discharges, not individual patients. Therefore, we cannot identify or adjust for patients who had multiple hospital visits in a year. Moreover, we used a broad definition of OUD based on any diagnosis code related to it rather than a more specific algorithm that requires repeated indications. This may affect our observed trends, as patients with more severe conditions may be overrepresented in our sample. However, this risk is likely small, as only a small fraction of our sample had the most severe loss of function category. Notwithstanding, we did account for diagnosis positions in supplemental analyses and adjust for severity to tease out these severity impacts and ensure more robust findings. Further, each individual year was isolated given the nature of NIS captured data; thus, our analysis tested and compared each year individually rather than performing a longitudinal analysis. As this is a retrospective, correlational study, potential residual confounding due to unmeasured confoudners (e.g., problems related to lifestyle, other social determinants of health, access to outpatient care etc.) can exist. Finally, our discussion of Covid-19 was limited by the data availability, as we could only examine one year of data and not assess any changes over further follow-up time post pandemic.
The Covid-19 pandemic has potentially influenced the management of OUD, as many healthcare practices shifted to remote consultations and medication renewals without in-person evaluations. This could have led to an increase in undetected OUD cases. Additionally, given that opioids depress ventilatory drive, there may be implications for out-of-hospital deaths from Covid-related respiratory problems. While these considerations are beyond the scope of our current study, they highlight important areas for future research to fully understand the impact of the pandemic on OUD patients and their healthcare utilization patterns.
Our study suggests a link between OUD status and healthcare utilization patterns. We found that OUD patients had longer hospital stays but lower total costs and charges than non-OUD patients with convergence in cost/charge differences between OUD/non-OUD patients in recent years. However, our data source had limitations in capturing the individual-level utilization across multiple visits and settings. Future research should use more comprehensive data to examine the total healthcare utilization per person with OUD. We did not find evidence that Covid-19 affected OUD patients differently than non-OUD patients generally, however when breaking out OUD groups by diagnosis positioning, those with greater likelihood of comorbid OUD had higher total costs and charges than those without OUD, with significant differences in 2020. The pandemic may have other impacts on OUD patients that require further investigation with more recent data.
The data that support the findings of this study are available from the Healthcare Cost and Utilization Project (HCUP), but restrictions apply to the availability of these data, which were used under license for the current study. The data are not publicly available due to the data use agreement executed with HCUP. However, data are available from HCUP upon reasonable request and with permission of HCUP. More information about accessing HCUP data can be found on their website: https://hcup-us.ahrq.gov/.
- OUD:
-
Opioid Use Disorder
- HCUP:
-
Healthcare Cost & Utilization Projects
- NIS:
-
National Inpatient Sample
- GLM:
-
Generalized Linear Modeling
- ED:
-
Emergency Department
- SAMHSA:
-
Substance Abuse and Mental Health Services Administration
- SID:
-
State Inpatient Databases
- CCR:
-
Cost-to-Charge Ratio
- HCRIS:
-
Healthcare Cost Report Information System
- ICD-9:
-
International Classification of Diseases, Ninth Revision
- ICD-10:
-
International Classification of Diseases, Tenth Revision (ICD-10)
- IQR:
-
Inter-Quartile Range
- CI:
-
Confidence Interval
This study used data from the National Inpatient Sample (NIS), Healthcare Cost and Utilization Project (HCUP), Agency for Healthcare Research and Quality (AHRQ). The authors acknowledge the HCUP and AHRQ for providing the data for this research (https://hcup-us.ahrq.gov/). We also acknowledge the HCUP data collection partners (www.hcup-us.ahrq.gov/hcupdatapartners.jsp). The conclusions, findings, and opinions expressed by authors contributing to this study do not necessarily reflect the official position of the NIS, HCUP, or the AHRQ.
Given the retrospective nature of this study and the use of de-identified data from the Healthcare Cost and Utilization Project (HCUP), Institutional Review Board (IRB) approval and informed consent were not required. The need for consent to participate was deemed unnecessary according to U.S. federal regulations at 45 CFR 46.104(d)(4), which exempts research involving secondary analysis of de-identified data. This study was conducted in accordance with the ethical standards of the Declaration of Helsinki and national and institutional guidelines.
Not applicable.
The authors declare no competing interests.
Springer Nature remains neutral with regard to jurisdictional claims in published maps and institutional affiliations.
Open Access This article is licensed under a Creative Commons Attribution-NonCommercial-NoDerivatives 4.0 International License, which permits any non-commercial use, sharing, distribution and reproduction in any medium or format, as long as you give appropriate credit to the original author(s) and the source, provide a link to the Creative Commons licence, and indicate if you modified the licensed material. You do not have permission under this licence to share adapted material derived from this article or parts of it. The images or other third party material in this article are included in the article’s Creative Commons licence, unless indicated otherwise in a credit line to the material. If material is not included in the article’s Creative Commons licence and your intended use is not permitted by statutory regulation or exceeds the permitted use, you will need to obtain permission directly from the copyright holder. To view a copy of this licence, visit http://creativecommons.org/licenses/by-nc-nd/4.0/.

Qeadan, F., Nicolson, A., Tingey, B. et al. Healthcare utilization trends among patients with opioid use disorder in U.S. Hospitals: an analysis of length of stay, total charges, and costs, 2005–2020. BMC Health Serv Res 25, 927 (2025). https://doi.org/10.1186/s12913-025-13095-9