Injury Epidemiology volume 12, Article number: 32 (2025) Cite this article
Veteran suicide remains a major public health concern; rates increased 64.3% from 2001 to 2022 and substantial geospatial variation exists, with state-level rates ranging from 15.4/100,000 (Maryland) to 87.1/100,000 (Montana). Surveillance of suicidal ideation (SI) and suicide attempts (SA) can provide insights to reduce suicide risk within communities.
A population-based, cross-sectional survey of 17,949 Veterans residing in all 50 U.S. states, the District of Columbia, Puerto Rico, and U.S. Pacific Island (PI) Territories, was conducted in 2022 to assess SI and SA prevalence. Lifetime and post-military SI and SA and past-year SI prevalence were estimated by Census region, division, and state. Prevalence ratios were calculated for post-military SI and SA to assess differences by division, accounting for demographic covariates (i.e., age, race, gender, rurality, and time since military separation). Methods used in lifetime SA and considered in past-year SI were also examined by region.
The West had the highest prevalence of lifetime (36.94%; 95%CI = 34.65–39.23) and post-military SI (28.73%; 95%CI = 26.51–30.96), significantly higher than all other regions except for PI Territories and Puerto Rico. PI Territories had the highest prevalence of past-year SI (15.68%; 95%CI = 10.91–20.44) and lifetime (9.86%; 95%CI = 6.36–13.37) and post-military SA (5.67%; 95%CI = 3.21–8.14). At the divisional level, the Pacific West (29.12%; 95%CI = 26.01–32.23) and West South Central (29.09%; 95%CI = 26.18-32.00) divisions had the highest prevalence of post-military SI, while West South Central had the highest prevalence of post-military SA (6.89%; 95%CI = 5.07–8.70), and the PI Territories remained highest for lifetime SA. After adjusting for covariates, numerous significant differences across divisions were observed. Differences in suicide methods considered and used were also observed across regions.
Variability in SI and SA prevalence among Veterans at state, divisional and regional levels supports the need for nuanced surveillance efforts, along with targeted prevention efforts in areas at greatest risk.
Suicide among U.S. Veterans continues to be a serious public health concern; in 2022, suicide was the 12 th leading cause of death among Veterans, and suicide rates increased 64.3% from 2001 (17.1/100,000)Footnote 1 to 2022 (28.1/100,000) [1, 2]. Further, in 2022, while Veterans made up approximately 6.1% of the U.S. adult population, 13.4% of adult suicides in 2022 occurred among Veterans [2, 3]. However, there is significant geospatial variation in suicide rates among Veterans, which range from 25.0/100,000 in the Northeast to 40.4/100,000 in the West [4]. Identifying geographical differences in Veteran suicide rates can help with tailoring community-based prevention efforts.
Nonetheless, Census regions, which are used to calculate regional suicide rates, are large and heterogenous. This may obscure more granular geographic differences in rates. Indeed, state-level suicide rates among Veterans in 2022 ranged from 15.4/100,000 (Maryland) to 87.1/100,000 (Montana) [4]. Notably, both Montana and California (29.1/100,000) are in the West region, but have vastly different suicide rates among Veterans; this may be due to differences in rurality, access to firearms, and/or socioeconomic factors [5, 6].
Although division and state-level estimates provide a clearer picture of geographic trends in Veteran suicide rates, such findings are often limited. As part of the annual suicide prevention report, the Department of Veterans Affairs (VA) publishes state data sheets [4]. While helpful in providing states with information specific to their Veteran population, state suicide rates are limited to crude, rather than age- and sex-adjusted, rates, limiting comparisons between states [4]. Furthermore, suicide rates for some territories are not available, even unadjusted. Estimates at the Census division level are not available, nor can they be calculated from the VA data appendix due to suppression of values where the number of suicide deaths is less than 10 to protect privacy. Thus, additional approaches to understand Veterans’ state- and division-level suicide risk are necessary.
Surveillance of suicidal ideation (SI) and suicide attempts (SA) can provide valuable insight into geographical trends in suicide risk that can inform prevention. SI and SA are among the strongest predictors of future suicidal behavior, including suicide [7]. Specifically, Veterans who attempt suicide have nearly twice the hazard of all-cause mortality than Veterans who do not after adjustment for age and gender [8]. Moreover, SI and SA can be distressing to those who experience them and have additional physical and psychosocial impacts; Veterans with a history of SA have worse subsequent psychological well-being compared to those with no history of SA even after accounting for mental health symptoms (e.g., depression) [9]. In the general U.S. population, non-fatal self-directed violence, including SI and SA, costs an average of $13.1 billion in medical costs and $3.2 billion in work loss each year [10]. Furthermore, suicide, SA, and SI among Veterans have significant psychological impacts for family members, friends, and fellow Veterans, including SI and SA, mental health symptoms, and social isolation [11]. Thus, SI and SA are important clinical outcomes. Understanding how they vary across regions, divisions, and states can help tailor efforts intended to improve well-being and prevent Veteran suicide.
While studies have examined the prevalence of SI and SA among Veterans, none have obtained a large, nationally representative sample equipped to examine these geographical differences. To address this gap, the current manuscript aimed to describe geographic variation in prevalence of SI and SA among Veterans, using data from the Assessing Social and Community Environments with National Data for Veteran Suicide Prevention (ASCEND) study, a population-based, cross-sectional national survey designed to conduct non-fatal suicidal self-directed violence surveillance [12]. ASCEND data were analyzed to describe and visualize the geographic distribution of SI and SA based on region, division, and state/territory, as well as to describe suicide methods considered and used by region. We also compared the prevalence of SI and SA across Census divisions.
ASCEND is a recurring, population-based, cross-sectional survey. Wave 1 (2022) included a main study sample (all U.S. states, Washington D.C., and Puerto Rico); and a U.S. Pacific Islands (PI) Territories pilot sample (Guam, American Samoa, and the Commonwealth of the Northern Mariana Islands [CNMI]); both samples are included in the present manuscript [12, 13].Footnote 2 Both samples were drawn from a population frame of all living U.S. Veterans (N = 16,738,616, as of 06/2021), constructed from U.S. Veterans Eligibility Trends and Statistics (USVETS) and the VA-DoD Identity Repository (VADIR) data [14]. Frame data were used to classify records according to groups pertinent to the stratified sampling design (i.e., state/territory of residence, sex, race/ethnicity, and date of separation for main sample and territory of residence for PI sample). Additional sampling details have been described previously [12, 13]. A total of 17,949 Veterans participated in Wave 1 (17,396 in the main study; 553 in the PI pilot). A 10-week recruitment protocol was implemented from 03/2022 to 06/2022; across both the main and pilot samples, respondents completed the survey by web (74.5%), paper (25.1%), or phone (0.5%) [12]. Response rates for the main and pilot samples were 19.2% and 21.6%, respectively. Yield by state/territory is provided in Supplemental Table 1.
The Wave 1 survey assessed a broad range of constructs, including demographic and military characteristics, SI and SA, and risk and protective factors for suicide. Constructs relevant to the present analyses are described.
SI and SA
A modified self-report version of the Columbia Suicide Severity Rating Scale (C-SSRS) was administered [12, 15]. The C-SSRS is a widely used measure of non-fatal suicidal self-directed violence, and is used nationally in VHA to screen for suicide risk. The ASCEND version was expanded and developed in a pilot study in which feedback from Veterans was received [16]. Lifetime SI was defined as a positive response to any questions regarding SI (i.e., thoughts of killing self), SI with consideration of method (i.e., thoughts about how you might kill yourself), and/or SI with a specific plan. SA was defined as having ever purposely hurt oneself with at least some intent to die. Respondents who endorsed experiencing lifetime SI or SA were asked about timing of SI and SA relative to their military service (before, during, and after) and about SI within the past year. Those who endorsed past-year SI were asked about methods considered during that time. Respondents who endorsed lifetime SA were also asked about method(s) used in prior attempts.
Geographical variables
The state or territory of residence for each participant was obtained from contact information provided on completed surveys. Regions (Northeast, Midwest, South, West)Footnote 3 and divisions (New England, Mid-Atlantic, East North Central, West North Central, South Atlantic, East South Central, West South Central, Mountain West, Pacific West)Footnote 4 were classified using standard US Census Bureau definitions [17]. PI Territories included Guam, CNMI, and American Samoa. While Puerto Rico is in the Caribbean Island Territories region, it was the only Caribbean Island territory included in Wave 1 and thus was analyzed separately as both a region and division for this analysis. Rurality was classified based on the rural-urban commuting area (RUCA) code of the zip code provided from contact information on completed surveysFootnote 5. Veterans with an invalid zip code (n = 39) or a zip code that corresponded with an Army Post Office (APO) or Fleet Post Office (FPO) (n = 8) were coded as missing for rurality.
Demographics and military service characteristics
Self-reported demographics included: age, gender, and race. Time since last military separation was calculated based on year of last separation (self-reported) and year of survey completion.
All analyses were conducted using SAS version 9.4 and R version 4.3.2. and weighted to account for the complex survey design and propensity for non-response to reduce bias and enhance generalizability of results [12]. Non-response weights adjusted for differential non-response among sampled groups. Specifically, response propensity was associated with age, race, ethnicity, rurality, recent use of VHA services, and time since military separation. Thus, non-response weights accounted for potential bias introduced by these associations [12]. In addition to non-response adjustment, final weights used in all analyses included design weights and eligibility adjustment, and were raked to align with the Veteran population. Unweighted and weighted frequencies, proportions and 95% confidence intervals (CIs) were calculated for lifetime and post-military SI and SA, as well as past-year SI, by region, division, and state/territory. Similarly, proportions and 95% CIs were calculated for methods considered among those with past-year SI and methods used among those with lifetime SA, by region. All prevalence estimates were evaluated using the National Center for Health Statistics Data Presentation Standards for Proportions [18]. Estimates deemed unreliable based on these standards were suppressed; for this reason, it was not possible to report methods considered or used by division or state/territory. Reliable estimates were compared based upon evaluation of overlapping CIs; when 95% CI did not overlap, estimates were considered significantly different. Prevalence ratios (PRs) were calculated using weighted modified Poisson regression models with robust standard errors to compare post-military and past-year SI and post-military SA by division, accounting for covariates of interest [19]. Covariates in adjusted models, selected a priori based on literature on demographic differences in suicide rates, included age (18–34, 35–49, 50–64, 65+), race (White, Black, American Indian/Alaska Native, Asian, Native Hawaiian, Pacific Islander, other, multiracial), gender (man, woman, transgender, non-binary/other), rurality (rural or urban), and time since military separation (< 4 years, 4–9 years, 10 + years) [2]. No specific division was used as a reference group for comparison; all pairwise comparisons were made. PI Territories were excluded from modeling due to differences in sampling design and subsequent weight construction precluding their inclusion in the main sample; Puerto Rico was excluded from modeling due to small sample size.
Within the main sample, Veterans primarily lived in the South (44.06%; 95%CI = 43.53–44.60), followed by the West (22.21%; 95%CI = 21.70–22.72), Midwest (20.52%; 95%CI = 20.08–20.95), Northeast (12.82%; 95%CI = 12.48–13.61), and Puerto Rico (0.39%; 95%CI = 0.31–0.47). By state/territory, the highest proportion of Veterans lived in Texas (South; 8.52%; 95%CI = 8.23–8.81), followed by California (West; 7.94%; 95%CI = 7.54–8.33) and Florida (South; 7.63%; 95%CI = 7.38–7.88) (Supplemental Table 2). Within the PI Territories sample, most Veterans lived in Guam (86.84%; 95%CI = 82.73–90.94) (Supplemental Table 2).
The age distribution of Veterans did not differ significantly by region, with the largest portion of Veterans > 65 years (range: 40.41–43.55%) and the smallest portion of Veterans 18–34 years (range: 8.83–10.91%) across regions (Supplemental Table 3). Approximately 90% of Veterans were men across all regions, though a larger proportion of women Veterans lived in the South (12.17% 95%CI = 11.71–12.63) relative to all other regions. While the majority of Veterans were White, there were racial differences across regions. The South had a significantly higher proportion of Black Veterans (16.09%; 95%CI = 15.17–17.02), and the PI Territories (9.94%; 95%CI = 6.69, 13.19; Supplemental Table 3) and West (3.32%; 95%CI = 2.67–3.97) had a higher proportion of Asian Veterans, compared to other regions. Additionally, the PI Territories had a higher proportion of Pacific Islander (45.87%; 95%CI = 37.29–54.46) and multi-racial (23.98%; 95%CI = 10.83–37.12) Veterans. Nearly one-third of Veterans in the Midwest (31.26%; 95%CI = 29.24–33.28) lived in a rural area, more than all other regions. Finally, approximately 90% of Veterans in all regions had been separated from military service for 10 years or more.
In the overall main sample (i.e., all 50 states, Washington, D.C., and Puerto Rico), the prevalence of lifetime SI was 31.98% (95%CI = 30.97–32.99), prevalence of SI after military separation was 25.88% (95%CI = 24.91–26.85), and prevalence of past-year SI was 12.69% (95%CI = 11.90–13.47) [12]. For SA, the prevalence of lifetime SA in the main sample was 6.99% 95%CI = 6.41–7.56) and SA after military separation was 4.88% (95%CI = 4.39–5.36) [12].
SI
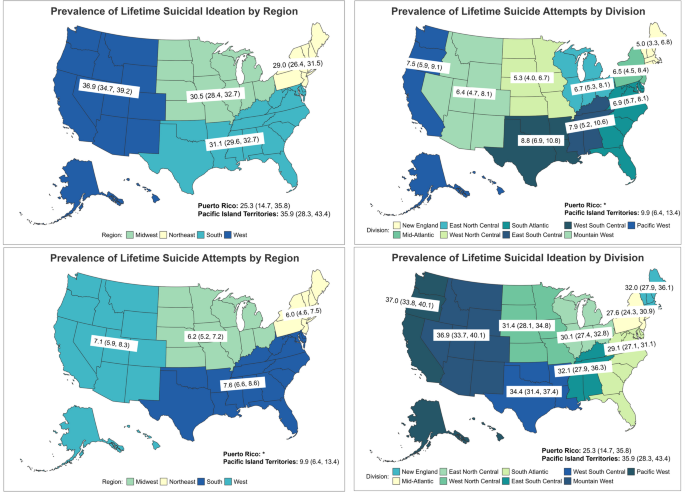
In the West, 36.94% (95%CI = 34.65–39.23) of Veterans reported lifetime SI, which was significantly higher than in the South (31.11%; 95%CI = 29.56–32.66), Midwest (30.54%; 95%CI = 28.42–32.65), and Northeast (28.95%; 95%CI = 26.36–31.53) (Table 1). PI Territories had a similarly high prevalence of lifetime SI (35.86%; 95%CI = 28.34–43.39) to the West. Puerto Rico had the lowest regional prevalence of lifetime SI (25.28%; 95%CI = 14.72–35.84) (Fig. 1).
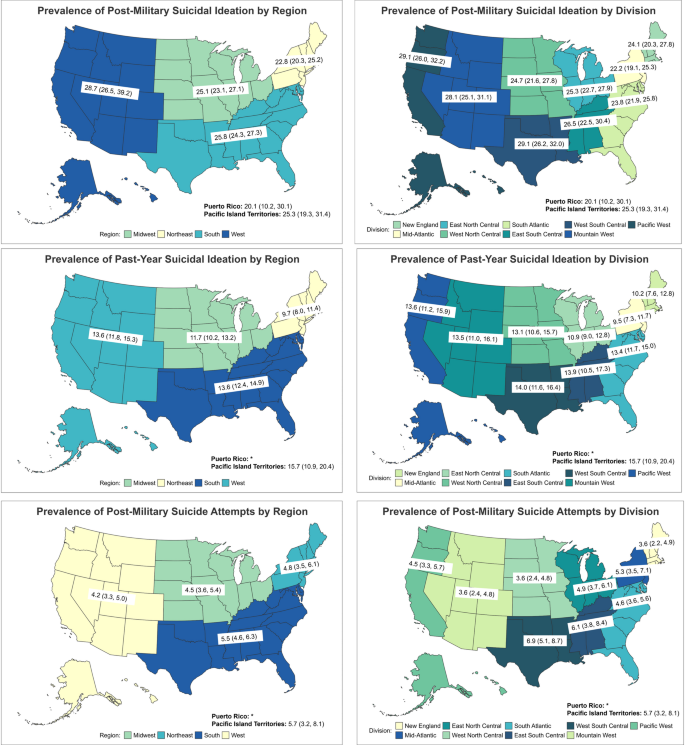
SI after separation from military service was also highest in the West (28.73%; 95%CI = 26.51–30.96), followed by the South (25.77%; 95%CI = 24.28–27.26), PI Territories (25.34%; 95%CI = 19.29–31.39), Midwest (25.08%; 95%CI = 23.06–27.11), Northeast (22.76%; 95%CI = 20.34–25.18), and Puerto Rico (20.13%; 95%CI = 10.17–30.08). Post-military SI prevalence in the West was significantly higher than in the Northeast (Fig. 2).
Maps of Prevalence Estimates of Post-Military and Past-Year Suicidal Ideation and Post-Military Suicide Attempt by Region and Division
Veterans in PI Territories (15.68%; 95%CI = 10.91–20.44) had the highest prevalence of past-year SI, followed by those in the West (13.55%; 95%CI = 11.81–15.29), and South (13.62%; 95%CI = 12.35–14.89). Past-year SI prevalence was lowest in the Northeast (9.69%; 95%CI = 7.96–11.43) (Fig. 2).
Among Veterans who reported suicidal ideation in the past year, gunshot was the most commonly considered method in the Midwest (43.65%; 95%CI = 36.43–50.86), West (40.92%; 95%CI = 33.58–48.27), and South (39.01%; 95%CI = 33.81–44.20), while motor vehicle crash was the most commonly considered method in the Northeast (35.68%; 95%CI = 26.38–44.97) and PI Territories (32.77%; 95%CI = 19.38–46.16) (Table 2). Overdose of medications was among the three most commonly considered methods in all regions; however, overdose of illegal drugs was the fourth most commonly considered method in the Midwest (11.32%; 95%CI = 6.43–16.21), but was not among the five most common methods in any other region.
SA
Prevalence estimates for Puerto Rico were suppressed due to potential unreliability (Table 1). The highest proportion of lifetime SA was observed for Veterans in PI Territories (9.86%; 95%CI = 6.36–13.37), followed by the South (7.60%; 95%CI = 6.63–8.57), West (7.07%; 95%CI = 5.89–8.25), Midwest (6.20%; 95%CI = 5.18–7.23), and Northeast (6.02%; 95%CI = 4.58–7.47), though differences were not significant (Fig. 1). Similarly, Veterans in PI Territories and the South appeared to have a higher prevalence of SA following separation from the military (range: 5.67–5.47%) while prevalence was lower among Veterans in the West, Midwest and Northeast (range: 4.15–4.77%), though these differences were also not statistically significant (Fig. 2).
Among Veterans with a lifetime suicide attempt, the most common method used was overdose of medications, followed by cutting/stabbing and gunshot across all regions (Table 3). Nearly two-thirds of Veterans in the Midwest (61.59%; 95%CI = 52.91–70.26) and South (61.54%; 95%CI = 54.67–68.40) reported using overdose of medications as a suicide attempt method, while approximately half of Veterans in the Northeast (49.52%; 95%CI = 36.66–62.38) and West (52.13%; 95%CI = 43.33–60.94) did. Of note, more Veterans in the Northeast reported using gunshot as a suicide attempt method (23.07%; 95%CI = 10.28–35.86) than in any other region, although this difference was not statistically significant.
SI
The Pacific West (36.99%; 95%CI = 33.83–40.07) and Mountain West (36.86%; 95%CI = 33.65–40.07) had the highest prevalence of lifetime SI (Fig. 1). These two divisions had significantly higher prevalence than the Mid-Atlantic (27.59%; 95%CI = 24.33–30.86), South Atlantic (29.11%; 95%CI = 27.11–31.10) and East North Central (30.07%; 95% CI = 27.36–32.78). West South Central (34.41%; 95% CI = 31.43–37.40) had higher prevalence than the Mid-Atlantic and South Atlantic (Table 4). There were no other significant differences.
Regarding SI following separation from military service, the Pacific West (29.12%; 95%CI = 26.01–32.23), and West South Central divisions (29.09%; 95%CI = 26.18–32.00) had the highest prevalence, significantly higher than Mid-Atlantic (22.18%; 95%CI = 19.09–25.27) or South Atlantic (23.84%; 95%CI = 21.92–25.76) divisions (Fig. 2). No other divisions differed from each other. No significant differences were observed in past-year SI by division (Fig. 2), although prevalence estimates appear somewhat lower for East North Central (10.91%; 95%CI = 8.99–12.84), New England (10.18%, 95%CI = 7.55–12.82), and Mid-Atlantic (9.47%; 95%CI = 7.26–11.69) than in other divisions (range: 13.14–15.68%).
SA
PI Territories (9.86%; 95%CI = 6.36–13.37) and West South Central (8.84%; 95%CI = 6.86–10.82) had the highest prevalence of lifetime SA (Fig. 1). Prevalence was significantly higher in West South Central than the West North Central (5.31%; 95%CI = 3.95–6.68) and New England (5.03%; 95%CI = 3.27–6.80) divisions (Table 4).
West South Central (6.89%; 95%CI = 5.07–8.70), East South Central (6.09%; 95%CI = 3.75–8.44) and PI Territories (5.67%; 95%CI = 3.21–8.14) had the highest prevalence of SA after separation from the military (Fig. 2). The West North Central (3.61%; 95%CI = 2.41–4.81) and Mountain West (3.58%; 95%CI = 2.38–4.77) divisions had significantly lower prevalence compared to the West South Central division, but there were no other significant differences.
SI
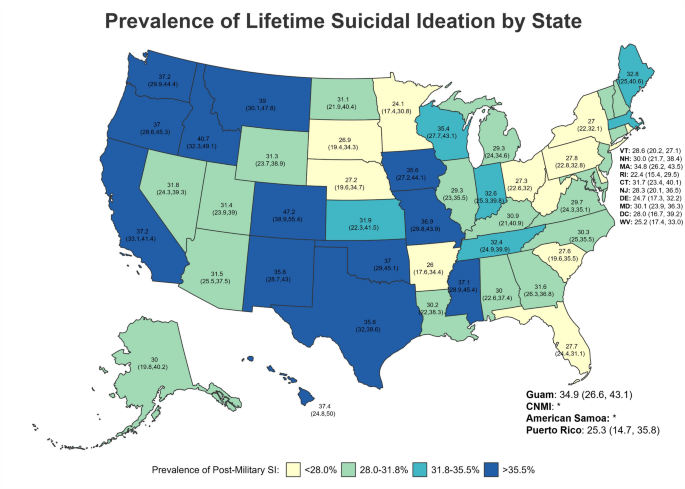
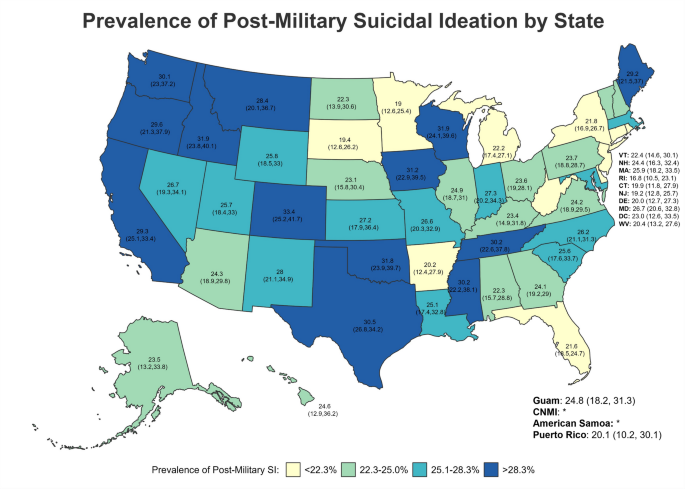
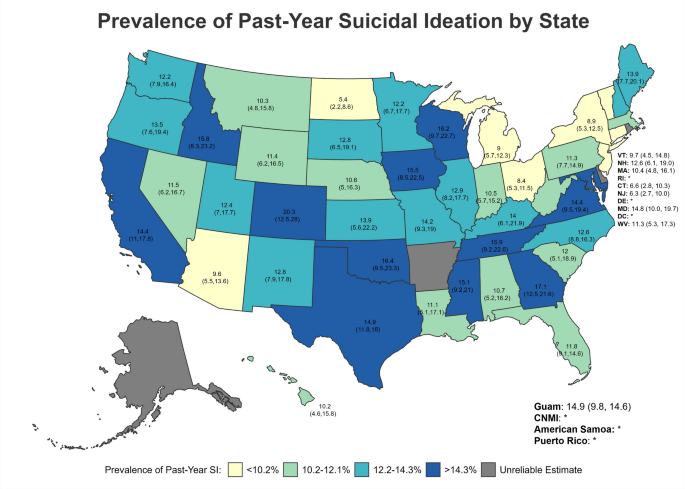
Across states/territories, the five with the highest lifetime SI prevalence (Fig. 3) were all in the West—specifically, Colorado (47.18%; 95%CI = 38.93–55.44), Idaho (40.74%; 95%CI = 32.34–49.14), Montana (38.95%; 95%CI = 30.13–47.78), Hawaii (37.43%; CI = 24.83–50.03), and California (37.23%; 95%CI = 33.06–41.40) (Table 5; Figs. 3, 4 and 5). However, for post-military SI (Fig. 4), the five highest prevalence estimates were in Colorado (33.43%; 95%CI = 25.16–41.71; West), Idaho (31.94%; 95%CI = 23.82–40.06; West), Wisconsin (31.86%; 95%CI = 24.14–39.59; Midwest), Oklahoma (31.77%; 95%CI = 23.88–39.66; South), and Iowa (31.20%; 95%CI = 22.89–39.52; Midwest). Finally, Colorado (20.27%; 95%CI = 12.51–28.03; West), Georgia (17.06%; 95%CI = 12.49–21.63; South), Oklahoma (16.41%; 95%CI = 9.47–23.34; South), Wisconsin (16.18%; 95%CI = 9.66–22.71; Midwest), and Tennessee (15.91; 95%CI = 6.21–22.61; South) had the highest prevalence of past-year SI (Fig. 5). Estimates of past-year SI prevalence were suppressed in some states and territories due to unreliable estimates.
SA
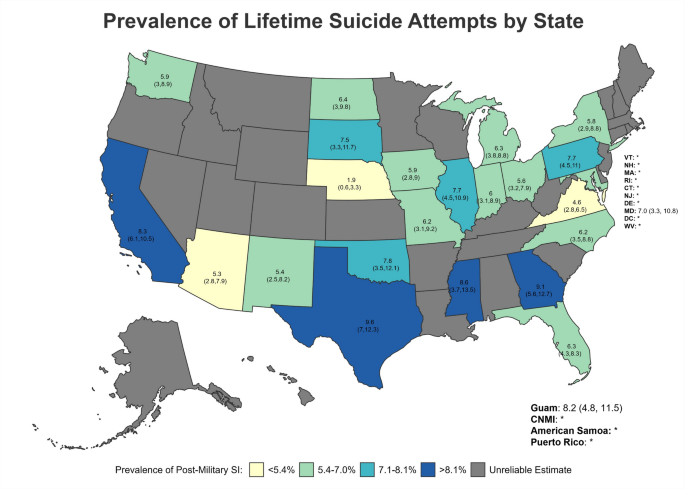
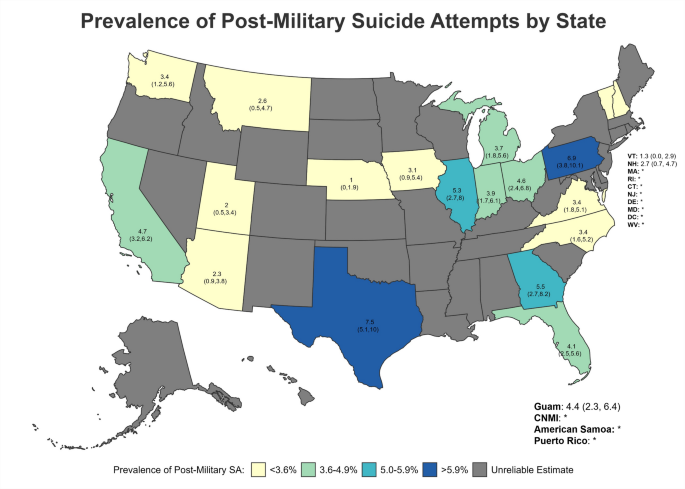
Suicide attempt estimates were suppressed in some states due to unreliable estimates. Among states for which estimates were considered reliable, the prevalence of lifetime SA (Fig. 6) was highest for Texas (9.63%; 95%CI = 7.01–12.25; South), Georgia (9.14%; 95%CI = 5.61–12.68; South), Mississippi (8.59%; 95%CI = 3.69–13.48; South), California (8.30%; 95%CI = 6.09–10.50; West), and Guam (8.19%; 95%CI = 4.84–11.54; PI Territories) (Table 6; Figs. 6 and 7). With regard to SA following separation from military service (Fig. 7), Texas (7.54%; 95%CI = 5.13–9.95; South), Pennsylvania (6.94%; 95%CI = 3.78–10.11; Northeast), Georgia (5.48%; 95%CI = 2.73–8.23; South), Illinois (5.32%; 95%CI = 2.70–7.95; Midwest), and California (4.69%; 95%CI = 3.19–6.18; West) had the highest reportable prevalence estimates.
SI
After adjustment for covariates, the Pacific West (PR = 1.30; 95%CI = 1.09–1.53), West South Central (PR = 1.27; 95%CI = 1.08–1.49), and Mountain West (PR = 1.22; 95%CI = 1.03–1.44) divisions had significantly higher prevalence of post-military SI compared to the Mid-Atlantic (Table 7). The Pacific West (PR = 1.20; 95%CI = 1.05–1.37) and West South Central (PR = 1.18; 95%CI = 1.04–1.33) also had significantly higher prevalence of post-military SI compared to the South Atlantic. The prevalence of post-military SI in the Pacific West was also higher than in the East North Central Division (PR = 1.17; 95%CI = 1.01–1.35).
Regarding past-year SI (Table 8), after adjustment, the East South Central (PR = 1.49; 95%CI = 1.08–2.06), West North Central (PR = 1.43; 95%CI = 1.06–1.93), West South Central (PR = 1.40; 95%CI = 1.05–1.86), and South Atlantic (PR = 1.36; 95%CI = 1.05–1.77) had significantly higher prevalence compared to the Mid-Atlantic.
SA
After adjustment for covariates, the West South Central division had a higher prevalence of post-military SA compared to the Mountain West (PR = 1.85; 95%CI = 1.21–2.83), West North Central (PR = 1.84; 95%CI = 1.19–2.83), New England (PR = 1.77; 95%CI = 1.10–2.85), Pacific West (PR = 1.47; 95%CI = 1.00–2.16), and South Atlantic (PR = 1.46; 95%CI = 1.04–2.04) (Table 9).
Our findings provide the first in-depth overview of geographic differences in prevalence of SI and SA among U.S. Veterans. The variability observed at state, divisional and regional levels supports the need for nuanced, detailed surveillance efforts. Further, consistent with the VA’s public health approach to suicide prevention, these findings support the importance of targeted efforts within areas at greatest risk [20].
Indeed, state and divisional findings underscore the importance of granular geographic estimates. For example, the West had the highest regional prevalence of post-military SI (28.7%), and the Pacific West maintained the highest prevalence of post-military SI at the division level (29.1%); however, the West South Central division (within the South region) had a similar prevalence of post-military SI (29.1%). For post-military SA, while PI Territories and the South had the highest regional prevalence (5.7% and 5.5%, respectively), risk in the South was more concentrated in the West South Central (6.9%) and East South Central (6.1%) divisions relative to the South Atlantic (4.6%). Finally, in comparing SI and SA findings by region and division, the Northeast region had the lowest prevalence of SI across timeframes as well as lifetime SA, yet SI prevalence estimates were higher in New England than the Mid-Atlantic for all timepoints and SA estimates were lower in New England than the Mid-Atlantic for all timeframes. State-level estimates provided a further nuanced understanding of geographical differences. All five states with the highest lifetime SI prevalence, and two of the five states with the highest post-military SI prevalence, were in the West, whereas three of the five states with the highest past-year SI prevalence were in the South. Elucidating such differences is critical given the import of targeting prevention efforts to more recent suicidal behavior.
Considering our findings in the context of geographic differences in suicide rates and emergency department visits for SI and SA highlights both consistencies and discrepancies. Specifically, in 2022, among Veterans, the West had the highest regional suicide rate (40.40/100,000), followed by the Midwest (35.70/100,000), South (34.30/100,000), and Northeast (25.00/100,000); a pattern mirrored in the general population [4]. This is consistent with our findings that, of those four regions, the West had the highest prevalence of lifetime and post-military SI, followed by the Midwest and South, with the Northeast having the lowest prevalence for all SI outcomes. Additionally, in the general population, the West had the highest prevalence of emergency department visits for SI or SA [21]. However, the West had the lowest prevalence of post-military SA in our analysis. This discrepancy may be due to a number of factors, including the high prevalence of firearm suicides in the West (71.4% of Veteran suicides in 2022), mental health stigma, and access to healthcare [22,23,24,25,26,27]. Indeed, the five states with the highest Veteran suicide rates in 2022—Montana, Utah, Nevada, Oregon, and Idaho—have high rates of both firearm ownership and firearm suicides [4, 22]. Moreover, there are highly rural areas within these states. Thus, relatively lower prevalence of suicide attempts in these states, in the context of high suicide rates, may be due to the use of highly lethal suicide methods, physical or cultural barriers to accessing mental health care, or deterrents to reporting suicidal ideation and behavior (e.g., stigma).
Relatedly, although we did not examine factors driving geographic differences in SI and SA, healthcare access, rurality, and mental health stigma may contribute to these differences [23,24,25,26,27] and will be important to examine in future research. These factors also may intersect to impact suicide risk. For example, healthcare access is more limited in rural areas (i.e., 62% and 78% of rural and highly rural Veterans, respectively, live in areas with greater than one hour travel time to the nearest VA health care facility care) and the likelihood of living in a rural area varies by region; in our analysis, double the proportion of Veterans in the Midwest lived in a rural area compared to the West [28]. Further, it is estimated that between 1 and 7 million Veterans do not have reliable internet access to receive care via telehealth, many of whom are located in rural areas [29]. Notably, lack of access to healthcare is directly associated with suicidal ideation in Veterans [30]. The impact of healthcare use is further compounded by stigma, which can hinder help-seeking [27, 31]. Areas with a strong “culture of honor” (i.e., cultures which emphasize defense of the reputation of oneself and family), such as the South (e.g., Texas) and West may also impact help-seeking behaviors due to reputation concerns, which may contribute to higher levels of suicidal ideation among Veterans in these areas, particularly among men [32].
Additionally, Veterans in rural areas have higher firearm ownership and differing attitudes towards firearms [23, 24]. Moreover, states in the Mountain West and West South Central, including Texas, as well as Maine (New England), have less stringent firearm laws and no waiting period for handgun purchase [33]. Additionally, states in the Mountain West, such as Colorado, Wyoming, and Montana, and the West South Central, such as Texas, have the highest proportions of Veterans living in rural and highly rural areas [28, 29]. Indeed, Veterans in rural areas have higher suicide rates and are more likely to use firearms (which have a highest case fatality rate) as their suicide method [23, 25, 34]. These factors may help to explain why specific regions that are highly rural (e.g., Mountain West) had a high prevalence of SI, but lower prevalence of non-fatal SA relative to other divisions, as the majority of SA using firearms result in death [34]. Additionally, travel time to a hospital is associated with increased fatality from suicide attempts of any methods, and longer transport times after any type of firearm injury is associated with increased mortality from the injuries [35, 36]. Shorter travel times to Level I or II trauma centers in the Northeast compared to other regions may thus partially explain why Veterans in the Northeast had the highest proportion of firearm use in non-fatal suicide attempts compared to other regions [37]; Veterans in the Northeast who attempt suicide using a firearm may be more likely to have access to life-saving emergency care. While future research to elucidate the combination of factors driving geographical variations in NF-SSDV is critical, targeted, community-level, upstream suicide prevention efforts are needed.
Socioeconomic stressors are also important to consider when examining regional differences in suicide risk. Homelessness, financial problems (including debt), food insecurity, and job loss are all associated with increased risk for suicide, suicidal ideation, and suicide attempts in Veterans [30, 38,39,40]. States in the South, such as Texas and Oklahoma, and West, such as New Mexico, California, and Oregon, have high poverty rates and high food insecurity compared to national levels, as well as high rates of Veteran unemployment [41, 42]. Furthermore, Pacific West states (e.g., California, Oregon, and Washington) and Texas have a high prevalence of unhoused Veterans [43]. Food insecurity and unemployment are also more common in rural areas [44, 45]. These socioeconomic factors may contribute to high prevalence of SI and SA in these areas.
This study has limitations to consider. First, SI and SA data were collected by self-report, which may be subject to recall and presentation bias, leading to underestimates [46, 47]. Additionally, though ASCEND aimed to collect data from a representative sample of all US Veterans, some state/territory sample sizes were small, particularly for estimating SA prevalence, leading to suppression of unreliable estimates. Recurring survey administration will facilitate combining data over time to produce more reliable and precise state-level estimates [12]. The response rate in both the main sample (19.2%) and the PI sample (21.6%) is comparable to other national studies of Veterans, including the Million Veteran Program (13%) and the Veterans Metrics Initiative (23%) [48, 49]. Nevertheless, there is potential for non-response bias. We have attempted to minimize such potential through purposeful sampling and mixed-mode data collection. Furthermore, our population sampling frame allowed for assessment of non-response and the development of non-response weights to correct for potential non-response effects. However, some non-response bias is still possible. Moreover, unstably housed Veterans are often harder to recruit for survey studies, which require a stable mailing address and social drivers of health related to transitional living arrangements may impact findings. Veterans residing in the U.S. Virgin Islands were not included and will be included in future waves of ASCEND. Finally, there is a potential for differential survivor bias to impact regional comparisons given that Veterans must be alive to be enrolled in the ASCEND study and suicide rates vary geographically (e.g., highest in the West). This underscores the need for primary prevention efforts for suicide in the Veteran population, as Veterans—both in general and in the West specifically—are more likely than the general population to use highly lethal means for suicide (i.e., firearms), increasing the likelihood of dying on their first suicide attempt [50].
Despite these limitations, these novel findings, situated in the context of extant literature, indicate that suicide prevention strategies for Veterans cannot use a one-size-fits-all approach. Developing and implementing tailored prevention strategies that consider geographic differences in suicide risk is requisite. For example, knowledge of geographic differences in suicide methods used in suicidal self-directed violence can be applied to inform region-specific lethal means safety efforts. Future research that illuminates regional differences in drivers of SI and SA will also be essential to targeted prevention efforts in each region. Finally, continued efforts to partner with communities in different regions are likely to be integral to implementing suicide prevention strategies that are responsive to the needs and unique considerations in each region [20, 51, 52].
Data cannot be shared publicly because of privacy and confidentiality requirements for this study. Specifically, institutional restrictions prohibit us from sharing this data publicly, as data from this study include potentially sensitive information from U.S. military Veterans. Thus, we do not have approval by our regulatory authority (the VA Rocky Mountain Regional VA Research and Development Committee) to share de-identified data publicly for this study. Rather, de-identified data can be accessed with a Data Use Agreement and verification of IRB approval from the requestor. Data are available from the VA R&D Committee (contact via 303-399-8020) for researchers who meet the criteria for access to confidential data. Our local regulatory authority (the VA Rocky Mountain Regional VA Research & Development Committee) is available to review any such requests.
This material is based on work supported by the U.S. Department of Veterans Affairs (VA) Office of Suicide Prevention and the VA Rocky Mountain Mental Illness Research, Education and Clinical Center (MIRECC) for Suicide Prevention. The contents do not represent the views of the U.S. Department of Veterans Affairs or the United States Government. The authors would like to thank NORC at the University of Chicago for their contributions to the Assessing Social and Community Environments with National Data (ASCEND) project, including sampling design, survey methodology, and data collection. The authors also would like to thank the ASCEND Veterans Engagement Board members for their contributions and input.
Funding for this work was provided by the U.S. Department of Veterans Affairs Office of Suicide Prevention. The funding body had no role in the design of the study, collection, analysis or interpretation of the data, or in writing the manuscript, but did have the opportunity to review the final manuscript.
Ethics approval to conduct this study was obtained from the Colorado Multiple Institutional Review Board (COMIRB# 20–0719) and the VA Eastern Colorado Healthcare System Research and Development Committee. Informed consent was obtained from all participants prior to initiating study procedures.
Not applicable.
The authors declare no competing interests.
Springer Nature remains neutral with regard to jurisdictional claims in published maps and institutional affiliations.
Open Access This article is licensed under a Creative Commons Attribution 4.0 International License, which permits use, sharing, adaptation, distribution and reproduction in any medium or format, as long as you give appropriate credit to the original author(s) and the source, provide a link to the Creative Commons licence, and indicate if changes were made. The images or other third party material in this article are included in the article's Creative Commons licence, unless indicated otherwise in a credit line to the material. If material is not included in the article's Creative Commons licence and your intended use is not permitted by statutory regulation or exceeds the permitted use, you will need to obtain permission directly from the copyright holder. To view a copy of this licence, visit http://creativecommons.org/licenses/by/4.0/.
Kittel, J.A., Monteith, L.L., Holliday, R. et al. Geospatial estimates of suicidal ideation and suicide attempt prevalence in the U.S. veteran population (2022). Inj. Epidemiol. 12, 32 (2025). https://doi.org/10.1186/s40621-025-00584-y
Received:
Accepted:
Published:
DOI: https://doi.org/10.1186/s40621-025-00584-y
