FEDS Note: Is China Really Growing at 5 Percent?
June 06, 2025
William L. Barcelona, Danilo Cascaldi-Garcia, Jasper J. Hoek, and Eva Van Leemput1
1. Introduction
Chinese authorities recently announced a growth target of "around 5 percent" for 2025, the same as their 2024 target. Five percent is about half the pace of growth that China sustained from the 1980s to the early 2010s, but it is nonetheless quite high for an economy flirting with deflation and mired in a years-long property bust. The ambitious growth target, given the circumstances, has led many observers of the Chinese economy to once again treat the official GDP data with skepticism. In this note, we revisit an alternative indicator of Chinese GDP growth developed by Barcelona et al. (2022) to examine whether official data overstate Chinese GDP growth. Our findings suggest that recent GDP growth figures, which have been in line with the stated target, appear to align closely with broader Chinese economic indicators and do not appear to be overstated. We find that the recent near-target growth has been driven by a strong supply-side performance, supported by sustained global demand for Chinese goods and industrial policies promoting self-reliance. This has helped offset weak domestic consumption, which never fully recovered from COVID-era lockdowns and continues to be constrained by the ongoing property slump.
2. China Alternative Indicator
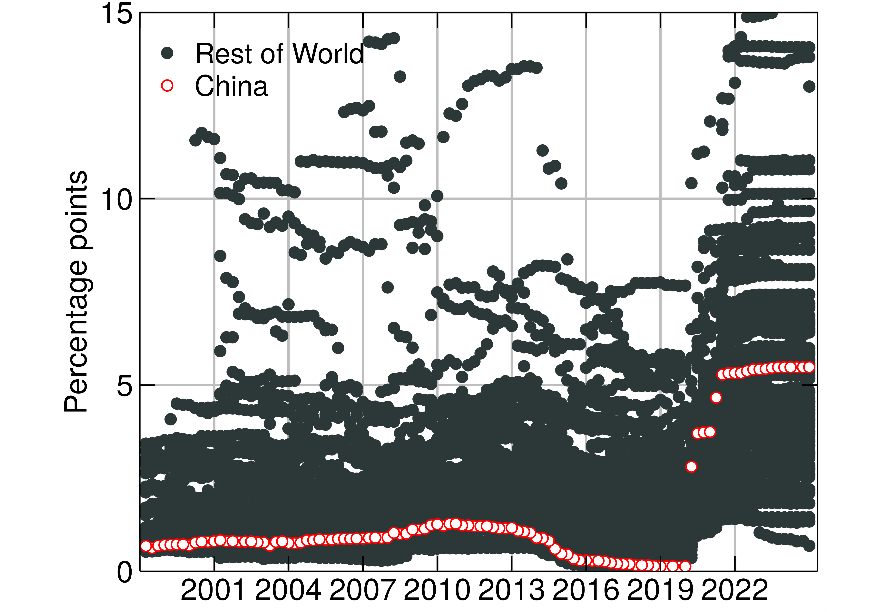
The motivation for the alternative GDP indicator developed in Barcelona et al (2022) was that Chinese GDP growth had become extremely smooth in the late 2010s (Clark et al., 2020; Fernald et al., 2021).2 This excess smoothness can be seen in Figure 1, which displays a measure of the volatility of GDP growth for a large set of countries, with China shown in red. The volatility of Chinese GDP growth began falling in the aftermath of the Global Financial Crisis (GFC), reaching one of the lowest levels globally by the end of the 2010s. However, at the onset of the COVID-19 pandemic, the volatility of Chinese GDP growth jumped. Granted, GDP growth became more volatile in virtually all countries, as lockdowns shut down economies around the world. But what is notable is that the volatility of Chinese GDP growth jumped from among the lowest globally to around the middle of the pack and has remained there since. It appears that the previously observed excess smoothness in China's GDP data has diminished in recent years.
In addition to becoming more volatile, Chinese GDP growth appears to have tracked other indicators of the Chinese economy more closely in recent years. Figure 2 compares the official four-quarter GDP growth rate from China's National Bureau of Statistics to our alternative measure of GDP growth. As outlined in Barcelona et al. (2022), our alternative GDP indicator relies on a large set of indicators that are informative about the Chinese business cycle, including industrial production, retail sales, property market data, and reported exports to China from other countries, among others. We extract a common factor from these series using a dynamic factor model and use this common factor to construct an alternative measure of Chinese real GDP. The main assumptions behind our alternative indicator are that official GDP is informative about the long run trend of GDP growth, while alternative indicators represent more accurate information about the cycle around that trend.
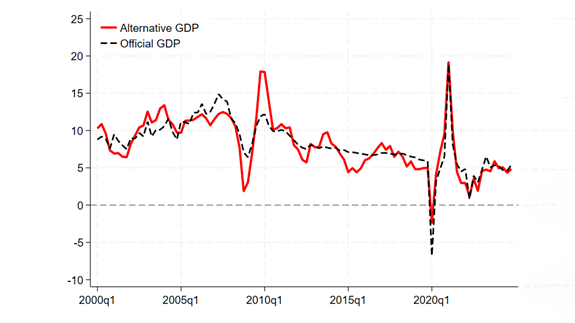
Several things are apparent from Figure 2. First, the plunge and subsequent rebound during the GFC was more pronounced according to our alternative indicators compared to official data. Second, the excess smoothness of official Chinese GDP growth following the GFC is striking. This period encompassed a period of financial distress when financial stability concerns and shifting views about China's growth potential led to a significant equity market correction, large and sustained capital outflows, and a destabilizing move in China's tightly managed exchange rate. Our alternative indicator suggests that GDP growth declined by 5 percentage points from early 2014 to early 2015, followed by a rebound of similar magnitude. In contrast, official GDP growth data exhibit minimal volatility around a smoothly declining trend.
Third, there is a clear structural break at the start of the pandemic. Starting with the sharp contraction in the first quarter of 2020—when China implemented its initial lockdown measures—official Chinese GDP growth has closely tracked our alternative GDP growth indicator, suggesting that recent official GDP figures are not overstated. Both measures have GDP growing at around 5 percent in recent quarters.
While 5 percent growth is far slower than the 10 percent average growth China sustained from the 1980s to the early 2010s, it could be considered high considering that China is undergoing a years-long property market correction. Prior to this downturn, estimates suggest that the property market directly or indirectly accounted for up to 30 percent of GDP, and the official data suggest that real estate and construction activity contributed more than 1 percentage point to GDP growth (Rogoff and Yang, 2024). With the property market bubble bursting over the past few years, that boost has turned into a drag that should be weighing materially on GDP growth.
3. China Activity Data
What explains the strong growth, relative to what the property sector malaise would suggest? We can get insights by looking at some of the indicators that go into the model. These indicators tell us that different parts of the Chinese economy fared very differently in the post-pandemic period.
Panel (a) of Figure 3 shows that while industrial production was severely disrupted during the initial lockdowns in Wuhan, it rebounded quickly and, if anything, has exceeded its pre-pandemic trend in recent years. This strength in production reflects in part the fact that China benefited from a shift of global demand from services to goods during the pandemic, which boosted its exports. In addition, China was able to minimize supply disruptions through its stringent "zero-COVID" policies, which limited the spread of the virus, as well as closed-loop management practices designed to keep factories running during COVID outbreaks. Notably, even the strict lockdowns in Shanghai in April 2022 did not greatly affect Chinese production. Finally, China's recent industrial policies aimed at promoting self-reliance, especially in high value-added sectors including semiconductors and electric vehicles, have also contributed to the strong production performance (de Soyres et al., 2024; Caines et al., 2025).
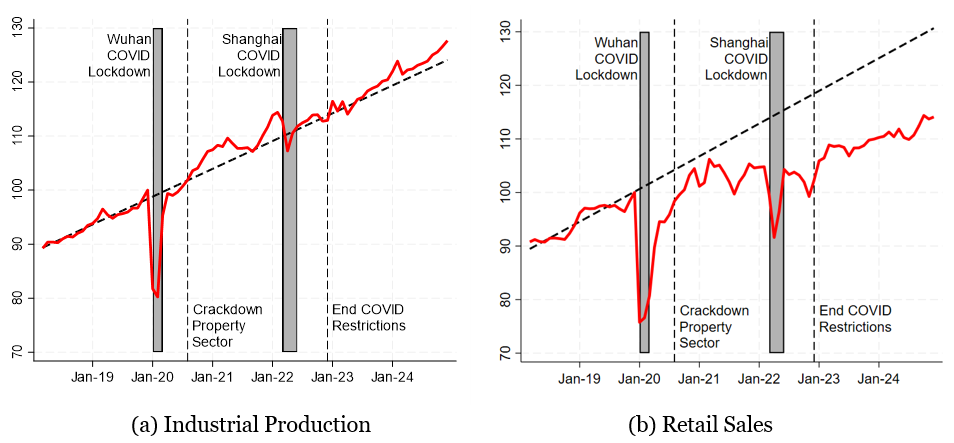
The strength of Chinese production contrasts sharply with the weakness of Chinese consumption over the period. As shown in panel (b) of Figure 3, Chinese real retail sales have fallen well below their pre-pandemic trend. The zero-COVID policies that helped sustain production likely weighed heavily on consumption, as prolonged restrictions dampened consumer activity. Retail sales were essentially flat from just prior to the lockdowns in Wuhan to the time when zero-COVID policies were lifted in late 2022. While consumption subsequently began to grow again, the pace of growth remains below its pre-pandemic trend.
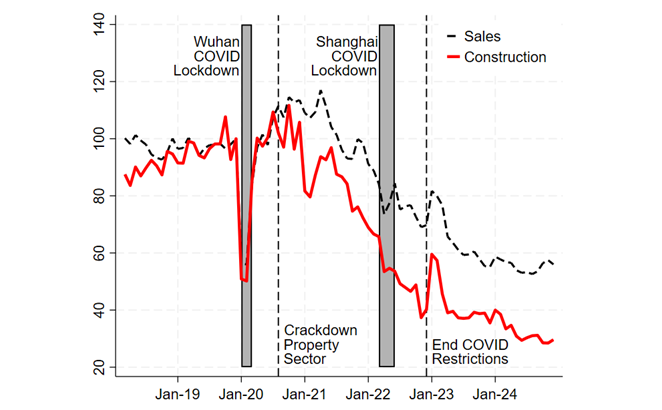
The crackdown on China's property sector has also weighed on consumption. China's "three red lines" policy, which set borrowing limits for China's highly indebted real estate developers, was introduced in August 2020 to let the air out of the overheated property market. As seen in Figure 4, residential construction and property sales are down more than 40 and 70 percent, respectively, since then. With nearly three quarters of Chinese households' wealth tied up in property, the property bust inevitably weighed on consumption.
The strength of Chinese industrial production together with the weakness of retail sales raise a question of where the corresponding demand for Chinese production is coming from. China's expenditure-side GDP data provide some clues, although limitations in the data, which are released only at an annual frequency and at a high level of aggregation, prevent us from offering more than a tentative answer to this question. The primary reason appears to be that foreign demand for Chinese production has been very strong. Indeed, the cumulative contribution of net exports to GDP for the 5-year period from 2020 to 2024 was higher than for any 5-year period since the GFC. Although the national accounts data do not break out the contribution of exports and imports separately, balance of payments data suggest that the increase in the net export contribution owes primarily to very strong export growth since the pandemic. In addition to strong external demand for Chinese products, an increase in manufacturing investment appears to account for some of the increase in demand. While this strength is obscured in the national accounts data, which shows that the contribution of investment to GDP growth declined slightly during the pandemic, China's fixed-asset investment data show that manufacturing investment as a share of GDP rose by over 2 percent of GDP between 2020 and 2024, but this increase was offset by a decline in real estate investment.
4. Conclusion
All told, assessing the accuracy of China's GDP growth remains a challenge and no statistical model can provide a definitive alternative measure. But our analysis suggests that official figures have not recently been overstating GDP growth for three reasons. First, the excess smoothness of official GDP has significantly diminished since the pandemic. Second, our alternative indicator, which relies on a broad set of data series informative about the Chinese business cycle, including consumption and the property sector, closely tracks official GDP. Finally, the supply side of China's economy has performed remarkably well in the context of robust demand for Chinese goods and industrial policies promoting self-reliance. This strength has offset notable weakness in Chinese consumption as COVID-19 lockdowns and property market weakness exerted persistent drags on pandemic-era consumption.
Growth over the past years received a big boost from net exports as real exports surged and real imports were flat. That is unlikely to be sustained, especially in the face of rising trade tensions. Moreover, with many manufacturing industries already suffering from overcapacity, there are limits to further increases in investment. As such, to maintain 5 percent growth going forward, China will need to strengthen consumption. The government's recently announced plan to boost consumption indicates a recognition of this need.
References
Barcelona W. L., D. Cascaldi-Garcia, J. J. Hoek, and E. Van Leemput (2022). "What Happens in China Does Not Stay in China", International Finance Discussion Papers, 1360.
Beaudoing, H. and M. Rodell, NASA/GSFC/HSL (2020), GLDAS Noah Land Surface Model L4 monthly 0.25 x 0.25 degree V2.1, Greenbelt, Maryland, USA, Goddard Earth Sciences Data and Information Services Center (GES DISC), Accessed: 4/3/2025, doi:10.5067/SXAVCZFAQLNO
Caines, C., S. Jeon, and C. Quijano (2025). "Developments in Chinese Chipmaking," FEDS Notes. Washington: Board of Governors of the Federal Reserve System.
Clark, H., M. Pinkovskiy, and X. Sala-i Martin (2020). China's GDP growth may be understated. China Economic Review, 62 (C).
de Soyres, F., and D. Moore (2024). "Assessing China's Efforts to Increase Self-Reliance," FEDS Notes. Washington: Board of Governors of the Federal Reserve System.
Fernald, J. G., E. Hsu, and M. M. Spiegel (2021). Is China Fudging its GDP Figures? Evidence from Trading Partner Data. Journal of International Money and Finance, 110, 102262.
Nakamura, E., J. Steinsson, and M. Liu (2016). "Are Chinese Growth and Inflation Too Smooth? Evidence from Engel Curves," American Economic Journal: Macroeconomics, 8 (3), 113–44.
Rogoff, K., and Y. Yang (2024). "Rethinking China's Growth". Economic Policy 39 (119): 517-48.
Appendix
The sample in Figure 1 includes the following 109 economies: Albania, Argentina, Australia, Austria, Azerbaijan, Bahrain, Belarus, Belgium, Belize, Bolivia, Bosnia and Herzegovina, Botswana, Brazil, Brunei, Bulgaria, Cameroon, Canada, Chile, China, Colombia, Costa Rica, Côte d'Ivoire, Croatia, Cyprus, Czech Republic, Denmark, Dominican Republic, Ecuador, Egypt, El Salvador, Estonia, Finland, France, Georgia, Germany, Ghana, Greece, Guatemala, Honduras, Hong Kong, Hungary, Iceland, India, Indonesia, Iran, Ireland, Israel, Italy, Japan, Jordan, Kazakhstan, Kenya, Kuwait, Latvia, Lesotho, Lithuania, Luxembourg, Macao, Malaysia, Malta, Mexico, Moldova, Mongolia, Morocco, Mozambique, Namibia, Netherlands, New Zealand, Nicaragua, Nigeria, North Macedonia, Norway, Palestinian Territories, Panama, Paraguay, Peru, Philippines, Poland, Portugal, Qatar, Romania, Russia, Saudi Arabia, Senegal, Serbia, Seychelles, Singapore, Slovak Republic, Slovenia, South Africa, South Korea, Spain, Sri Lanka, Sweden, Switzerland, Taiwan, Tanzania, Thailand, Tunisia, Turkey, United Kingdom, United States, Uganda, Ukraine, Uruguay, Venezuela, Vietnam, and Zambia.
Barcelona, William L., Danilo Cascaldi-Garcia, Jasper J. Hoek, and Eva Van Leemput (2025). "Is China Really Growing at 5 Percent?," FEDS Notes. Washington: Board of Governors of the Federal Reserve System, June 06, 2025, https://doi.org/10.17016/2380-7172.3784.
FEDS Notes are articles in which Board staff offer their own views and present analysis on a range of topics in economics and finance. These articles are shorter and less technically oriented than FEDS Working Papers and IFDP papers.