BMC Gastroenterology volume 25, Article number: 149 (2025) Cite this article
Computed tomography (CT) colonography is increasingly recognized as a valuable modality for diagnosing colorectal lesions, however, the interpretation workload remains challenging for physicians. Deep learning-based artificial intelligence (AI) algorithms have been employed for imaging diagnoses. In this study, we examined the sensitivity of neoplastic lesions in CT colonography images.
Lesion location and size were evaluated during colonoscopy and a large-scale database including a dataset for AI learning and external validation was created. The DICOM data used as training data and internal validation data (total 453 patients) for this study were colorectal cancer screening test data from two multicenter joint trial conducted in Japan and data from two institutions. External validation data (137 patients) were from other two institutions. Lesions were categorized into ≥6 mm, 6 to 10 mm, and ≥10 mm. During this study, we adopted a neural network structure that was designed based on the faster R-CNNs to detect colorectal lesion. The sensitivity of detecting colorectal lesions was verified when one and two positions were integrated.
Internal validation yielded sensitivity of 0.815, 0.738, and 0.883 for lesions ≥6 mm, 6 to 10 mm, and ≥10 mm, respectively, with a false lesion limit of three. Two external validation produced rates of 0.705 and 0.707, 0.575 and 0.573, and 0.760 and 0.779 for each lesion category. Combining two positions for each patient in calculating the sensitivity resulted in significantly improved rates for each lesion category.
The sensitivity of CT colonography images using the AI algorithm was improved by integrating evaluations in two positions. Validation experiments involving radiologists who can interpret images as well as AI to determine the auxiliary diagnosis can reduce the workload of physicians.
The age-adjusted morbidity and mortality rates of colorectal cancer in Japan continue to be the leading cause of cancer death, although they are decreasing for women, however, those for men remain high [1]. This may be attributable to not only the aging of the population but also low medical examination rates and low numbers of individuals who undergo detailed examinations (i.e., low acceptability of endoscopy examinations) [2, 3].
Incorporating computed tomography (CT) colonography [4], which has high acceptability as an examination and is less invasive, into detailed examinations is expected to increase the detailed examination rate. The sensitivity of CT colonography for the detection of colonic lesions ≥6 mm is comparable to that of colonoscopy [5,6,7,8,9]. However, the shortage of radiologists who can interpret images is a challenge to the dissemination of CT colonography. Compensating for this shortage requires the performance of primary evaluations by a radiological technician or reducing the diagnostic workload of physicians by introducing computer-aided detection (CAD). CAD was developed to detect neoplastic lesions during CT colonography [10, 11], and studies that included CAD without using deep learning have reported improved sensitivity of 65.4% to 76.9% for lesions 6 to 9 mm [12]. However, this method has not been widely applied in practice. This is because when targeting cancer, including advanced cases, there are several morphologies of neoplastic lesions in the large intestine that cannot be captured by humans. Furthermore, the existence of residue in the intestinal tract, poor wall extension, and wall thickening are obstacles to improving CAD accuracy. There is also the dilemma of many CAD applications detecting higher numbers of false-positive (FP) lesions with increased lesion sensitivities. However, the use of deep learning has been considered for resolving these issues. Therefore, we developed an artificial intelligence (AI) algorithm for detecting neoplastic lesions in the large intestine using images obtained during CT colonography. We also sought to evaluate the detection performance by conducting AI learning using digital imaging and communications in the medicine (DICOM) data of CT colonography performed at multiple facilities and validating the results. Furthermore, during the present study, we examined the lesion sensitivity in the two recommended positions (supine and prone) during CT colonography.
We used a convolutional neural network (CNN) for deep learning. This is an efficient method that does not require segmentation of the region of interest in advance and only requires simple annotation; therefore, it is thought to be a powerful tool for detecting tumors in images [13, 14]. The first step of deep learning involves annotating the lesion location. The second step involves the direct prediction of image characteristics and lesion features of a few CT images using the deep learning model. Furthermore, the use of CNNs enables visualization of the regions of the input image that are potentially important for model predictions and improving model interpretability (i.e., visual explanations that can be interpreted by humans) [13].
Using AI algorithms based on deep learning for the auxiliary diagnosis enables the identification of neoplastic lesions in images obtained during CT colonography. Additionally, they can prevent missed lesions, which is expected to reduce the burden of the diagnosing physicians.
The DICOM data of CT colonography were used to create a large-scale database, design an AI algorithm, and perform validation. To protect patient privacy, only image data, lesion information, sex, CT device (multidetector CT with at least 16 rows), slice thickness, and imaging position were used. The Strengthening the Reporting of Observational Studies in Epidemiology guidelines were followed during this study (Fig. 1). The research period spanned from October 2019 to August 2023, and the DICOM data used as training data were collected prior to this period. These data included screening tests from a multicenter joint trial conducted in Japan to validate the accuracy of CT colonography (Japanese National CT Colonography Trial) [15], data from another multicenter joint trial aimed at reducing the dose of intestinal cleansing agents while validating accuracy (Reduced-Laxative CT Colonography Trial) [16], and clinical data from Saitama Prefectural Cancer Center (Saitama) and Tonan Hospital (Tonan). The collected data were randomly divided into training and validation datasets. Table 1 shows the breakdown of the training data, including patient information, CT equipment used, and lesion size. During the present study, images obtained in one position were defined as one CT series; however, many images were obtained in two positions. In this study, we adopted the criteria used in previous research and defined lesions measuring 6 mm or larger as target lesions [3, 17]. Specifically, all target lesions were lesions ≥ 6 mm, and we categorized them into two groups: 6–10 mm and ≥ 10 mm. In most cases, the slice thickness was ≤1.0 mm. Although lesions ≥6 mm were included as targets in this study, the majority measured ≥10 mm. All lesions were pathologically confirmed to be adenomas or adenocarcinomas.
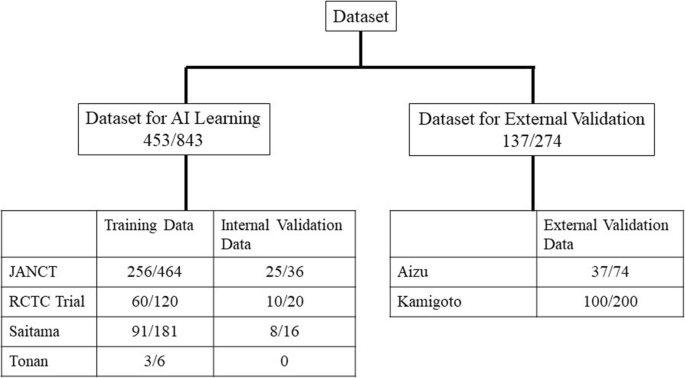
Study overview. The number of patients and series are shown for the AI training dataset and the external validation dataset, which were obtained from different institutes. The differences between the number of patients and the number of series are attributable to the fact that two CT examinations were performed per patient in two positions. AI: artificial intelligence; CT: computed tomography; JANCT: Japanese national CT colonography trial15; RCTC Trial: reduced-laxative CT colonography trial16.
Fig. 1 shows the numbers of patients and CT series in the AI learning dataset (training dataset and internal validation dataset) and external validation dataset. The AI learning datasets collected from the two previously published multicenter trials performed in Japan and the two aforementioned facilities were randomly divided into a training dataset used for AI training and an internal validation dataset that was used to validate the training results and there were no cases in each dataset that have been analyzed more than once. The external validation datasets of the two facilities of Fukushima Medical University Aizu Medical Center (Aizu) and Nagasaki Kamigoto Hospital (Kamigoto) were not used for AI learning.
This study was a retrospective re-analysis of two trials; therefore, informed consent was waived by Fukushima Medical University Ethics committee because of retrospective nature of the study. The data added to this study to validate diagnostic accuracy (validation dataset) were approved by the ethics committees of the four facilities of Saitama Prefectural Cancer Center (Saitama), and data from Tonan Hospital (Tonan), Fukushima Medical University Aizu Medical Center (Aizu), and Nagasaki Kamigoto Hospital (Kamigoto), then this study was approved by the institutional review board of Fukushima Medical University (2019-177). The research involved in this study was conducted in accordance with relevant guidelines and regulations, and the Declaration of Helsinki. The data obtained were anonymized, linked, and used in the present study under strict management and confidentiality guidelines. At each facility, the names of the patients (electronic medical record identifications) were replaced with research subject identifications for anonymization. A correspondence table was created to manage names (electronic medical record identifications) and research subject identifications. The correspondence table was strictly maintained at each facility and was not provided externally.
Primary endpoint and secondary endpoint
The primary outcome of this study is to evaluate the performance of the AI algorithm as the sensitivity of colorectal neoplastic lesions larger than 6 mm on CT colonography. The second is to validate the improved sensitivity achieved by merging CT images in two positions.
Information regarding the accumulated data
The intestinal pretreatment for CT colonography, characteristics of the lesions, and diagnostic method varied. The Japanese national CT colonography trial15 used a pretreatment similar to that for colonoscopy, and the Japanese reduced-laxative CT colonography trial16 used low-dose pretreatment with a reduced amount of a bowel cleansing agent to improve patient acceptability. The contrast agent used for tagging during the Japanese national CT colonography trial was amidotrizoic acid; however, during the reduced-laxative CT colonography trial, a non-ionic contrast agent was used. Both tests were performed for screening purposes, and many of the lesions were small. In this study, the correct results for all lesions were explicitly defined using colonoscopy findings as the reference standard. The Saitama and Tonan cases involved the same pretreatment as that used for colonoscopy, with CT colonography conducted after endoscopy. There were many cases in which expansion was good, with almost no residue or residual fluid in the large intestine. These datasets were used for the purpose of learning larger sized lesions, such as advanced cancers. The lesions were determined based on the findings of the radiologist after confirming the endoscopic findings. Other small lesions were not evaluated. Additionally, no contrast agent was used for tagging.
The dataset for external validation was from Aizu and Kamigoto, and the subjects were patients who had undergone both CT colonography and colonoscopy within the past 3 months. The detection of lesions in the large intestine during CT colonography was confirmed based on the colonoscopy findings. There were no stipulations regarding pretreatment, and the intestinal pretreatment and tagging methods of each facility were allowed; therefore, low-dose intestinal cleansing agents were used for some cases, no contrast agent was used for tagging for some cases, and amidotrizoic acid and barium preparations were used for some cases.
Annotation and lesion detection
Fig. 2 shows an example of annotation indicating the extent of a colorectal tumor and its coordinates in a CT image used for the development of an AI algorithm. Data regarding the lesion location and size (i.e., circumscribed rectangle) were specified based on the colonoscopy findings and the correct number of lesions included in the CT colonography images used for training and validation. The annotation process and training were carried out by radiologists with experience in reading CT colonography; however no strict rules were imposed. The training and internal validation set were completely randomized during division. Lesions smaller than 6 mm were not assessed in this study.

Annotations for colorectal lesions. Annotation of the bounding rectangle surrounding the colorectal lesions known a priori to be correct on the CT image. CT: computed tomography.
The CT colonography DICOM data were loaded into a research image analysis workstation; thereafter, we executed the CT colonography AI algorithm that was created. For each CT series, the number of FP lesions detected and the sensitivity were calculated for each position in which a lesion was present in each patient. The sensitivity was calculated by classifying the correct lesion size into three categories: ≥6 mm, 6 to 10 mm, and ≥10 mm. In general, the most commonly used a volume-based intersection over union (IoU) threshold for two-dimensional object detection is 0.5, which translates to approximately 0.35 for three-dimensional detection. However, accurately capturing lesions in CT images may be challenging. Therefore, we have considered it sufficient if the approximate position is correct. To account for this, we set the threshold more leniently at 0.53 = 0.125. which indicates that 50% or more of each side of the three-dimensional rectangle overlaps was overlapping and was considered an appropriate measure for confirming the position and size [18].
Information regarding the validation dataset
Table 2 shows the lesion size in the dataset used for internal validation. The Japanese national CT colonography trial dataset comprised 25 patients (36 series), the reduced-laxative CT colonography trial dataset comprised 10 patients (20 series), the Saitama dataset comprised 8 patients (16 series), and the Tonan dataset was not used. Validation was conducted by detecting polyps, including early cancer lesions, with a major axis ≥6 mm in the CT colonography images; however, as previously mentioned, the Saitama dataset targeted only large-sized advanced lesions or cancers diagnosed by radiologist based on endoscopic findings.
The Aizu dataset (37 patients [74 series]) and Kamigoto dataset (100 patients [200 series]) were used for external validation. These datasets included images obtained in two positions (supine and prone).
Explanation of the AI algorithm. Neural network architecture
During this study, we adopted a neural network structure [19, 20] that was designed based on the faster R-CNNs [21] (Fig. 3). The neural network was composed of two main subnetworks: region proposal network and region-based CNN. During the first stage, the region proposal network approximately detected lesion candidate regions in the input image and was composed of “feature extraction layers” and “region proposal layers.” IoU is an index that is calculated by using a bounding box that is delimited as the smallest rectangle of the lesion inferred by AI and a correct-answer bounding box that is delimited with the smallest rectangle of the correct lesion (ground truth annotated as the correct answer) in order to calculate the degree of intersection between the rectangles as follows.

Overview of the structure of the detection network. “Feature extraction layers” extracted features from CT colonography data, which are 3D image data, using 3D convolution. “Region proposal layers” obtained lesion candidate regions from the features. During the second stage, region-based CNNs accurately determined whether each candidate region detected during the previous stage was a target lesion and was composed of “region of interest align” and “region classification layers”. “Region of interest align” resized the features of the detected lesion candidate regions to a fixed size, and “region classification layers” determined whether each lesion candidate region was a lesion. 3D: three dimensional; RCNN: region-based convolutional neural network; RPN: region proposal network.
Preprocessing
The input image was resampled with approximately 1.0-mm isotropic pixels. Next, the CT values of -800 to 400 Hounsfield units were normalized as 0 to 1 and input into the network. Separately, the colorectal region was segmented using a large intestine extraction algorithm, and a circumscribed rectangular region of the colorectal region was cut out and input into the network.
Ensemble estimation
The aforementioned network was trained during this study using two groups of datasets with different characteristics as learning datasets. The data from the previous two trials primarily consisted of small lesions. In contrast, the Saitama and Tonan datasets included only large lesions as learning targets, excluding small lesions. When the algorithm, trained on both large and small lesions together, was tested on the Saitama and Tonan datasets, there was a possibility that its performance in detecting small lesion would decrease. We avoided this problem by training the neural network using the following two patterns: the pattern that included the Saitama and Tonan datasets as training data and the pattern that did not include these datasets. Furthermore, the neural network trained on the data of the two previous trials was prepared using the same data. We integrated the outputs of these three different neural networks with the inference (Fig. 4).

Schema of the process of integrating the outputs of three different neural networks. The first is a neural network trained on data from two previous trials with many small lesions and data from Saitama and Tonan with mainly large lesions. The second is a neural network trained on data from Saitama and Tonan. The third is a neural network trained on data from two previous trials. A trained model will have slightly different characteristics even with the same training data and same neural network; therefore, it is known that accuracy can be improved by using many trained models to obtain the final result by majority vote, which is called AI ensemble learning. RCNN: region-based convolutional neural network; RPN: region proposal network.
The detection algorithm outputs the lesion probability for the lesion candidate as a score. If this score is above a preset threshold, then the candidate lesion will be detected by AI and the sensitivity will be calculated. The neural network adopted for the present study was composed of two subnetworks: candidate lesion detection (during the first stage), which adopted all the candidates that were output by the three network types to detect candidate lesions of all sizes, and the simple average of these values, which were taken from the three networks to obtain the final lesion probability score (during the second stage). During the present study, the threshold value from 0 to 1 was divided into increments of 0.01 to evaluate the performance of CAD, which is a preliminary step of an image interpretation test, and the number of FP lesions detected was determined. For sensitivity, free-response receiver operating characteristic (FROC) analysis was performed and FROC curves were obtained from the true positive fraction and the numbers of false positives per CT image.
Evaluation of the sensitivity of the CT series in one position and the sensitivity for each patient evaluated in two positions
We examined the sensitivity using a CT series in one position and the sensitivity for each patient in two positions. We used an external validation dataset obtained in two positions to compare the sensitivities for each patient in the supine and prone positions, supine and both positions, and prone and both positions. We used the McNemar statistical test to evaluate the sensitivity for two paired groups when the number of FP lesions was between four and eight.
An example of a case in which a lesion within the residue could be detected with low-dose pretreatment and poor tagging is shown in Fig. 5. This lesion was thought to be difficult to detect using CAD that was designed with conventional lesion morphologies that should be detected by a human. The AI algorithm used during this study was able to correctly detect lesions buried in such residue in some cases.

Example case of detecting a lesion embedded in tagging residue. Arrow indicates the lesion of interest.
Fig. 6 shows FROC curves for each CT series in the internal validation dataset. The sensitivities for lesions ≥6 mm and lesions ≥10 mm were 0.815 and 0.883, respectively, when the allowed number of FP lesions per image was three. However, the sensitivities for lesions 6 to 10 mm when three or four FP lesions were allowed were low, with values of 0.738 and 0.785, respectively.

Sensitivities of the internal validation dataset based on CT series by FROC analysis. Sensitivity was evaluated in one position.
Fig. 7 shows FROC curves for the CT images of the Aizu and Kamigoto datasets. The sensitivities for lesions ≥6 mm and lesions ≥10 mm when four FP lesions were allowed were 0.755 and 0.810 with the Aizu dataset and 0.729 and 0.802 with the Kamigoto dataset, respectively. It was also confirmed that the sensitivity increased when the allowed number of FP lesions was increased. However, the sensitivities for lesions 6 to 10 mm were 0.625 and 0.593 when four FP lesions were allowed and 0.675 and 0.689 when eight FP lesions were allowed, respectively; these values were considered low.

Sensitivities of the external validation dataset per CT series by FROC analysis. Sensitivity was evaluated in each supine or prone position.
Fig. 8 also shows FROC curves per patient in the external validation dataset. Regarding the detection performance for each patient, if a correct lesion could be detected in either the supine or the prone position, then this was considered detection success, and the sensitivity was calculated. The number of FP lesions was the average value of the lesions detected in the supine and prone positions. The sensitivities for lesions ≥6 mm and lesions ≥10 mm when four FP lesions were allowed were 0.835 and 0.894 with the Aizu dataset and 0.848 and 0.866 with the Kamigoto dataset, respectively. Using this method, the sensitivity improved compared to that observed when evaluating each CT series in one position. Additionally, even for 6 to 10 mm lesions, the sensitivities when four FP lesions were allowed were improved, with values of 0.684 and 0.816, respectively. During the evaluation per patient, a plateau of the sensitivity was confirmed even after increasing the allowed number of FP lesions.

Sensitivities of the external validation dataset per patient by FROC analysis. Regarding the sensitivities for each patient, if a correct lesion could be detected in either the supine or the prone position, then this was considered detection success, and the sensitivities was calculated.
A comparison of the sensitivity using the CT series with one position and the sensitivity for each patient in two positions is shown in Table 3. There was no difference in the sensitivities obtained in the supine and prone positions using both the Aizu and Kamigoto datasets when the number of FP lesions was allowed to be as high as 4 or 8. When comparing the sensitivity of the two position combinations with single position (supine or prone), we found that there was an improvement of 16.0 - 32.1% for FP=4 and 14.4 - 38.0% for FP=8, which were statistically significant at p < 0.05 in McNemar statistical test.
This study involved a high-quality, large-scale AI learning dataset that was constructed and showed the correct lesion location and size based on colonoscopy examination results. Datasets obtained from two multicenter joint trials of CT colonography screening tests [15, 16] and preoperative tests for colorectal cancer with correct results were used as datasets for AI learning (453 patients [843 series]). These datasets were randomly divided into a training dataset and an internal validation dataset to create an AI algorithm. Furthermore, data of 137 patients (274 series) that were separately accumulated were used as an external validation dataset to evaluate the AI algorithm that was created. Lesions smaller than 6 mm were not targeted during this study because the guidelines for CT colonography do not recommend the detection of polyps smaller than 6 mm when indicated because this increases the FP rate [3, 17].
Validation of the internal validation dataset showed a high sensitivity for lesions ≥6 mm of 81.5% when the number of FP lesions per CT image was set to three. Because the evaluation method differs from previous research, direct comparison is not possible. However, the sensitivity for lesions ≥6 mm was 0.82 with data from the Japanese national CT colonography trial and 0.90 with data from the reduced-laxative CT colonography trial. The values of ACRIN CT colonography trial in USA [22] were 0.75 according to 3D image interpretation (primary 3D evaluation) and 0.793 according to a comparative study with capsule endoscopy [23], however, these studies were the results of image interpretation in two positions. However, during external validation, the sensitivities per series when the number of FP lesions was set to the same value decreased to 70.5% and 70.7%. The correct results are shown in the external validation dataset, but these were images obtained in actual clinical practice. Some factors make it difficult to distinguish lesions, such as irregularities in the surface shape of the large intestine and uneven colon wall caused by the existence of solid residue or insufficient intestinal dilatation. Deep learning-based AI algorithms are generally thought to have low robustness for small changes in images [20, 24]. It is thought that these factors caused the AI algorithm to respond incorrectly, resulting in a decreased sensitivity. However, it was also found that allowing a larger number of FP lesions increased the sensitivity.During this study, the sensitivity in two positions were also evaluated, but setting the allowed number of FP lesions to four resulted in high values of 0.835 and 0.894 for lesions ≥6 mm and ≥10 mm for Aizu and 0.848 and 0.866 for lesions ≥6 mm and ≥10 mm for Kamigoto, respectively. In actual clinical practice, it is recommended that CT colonography should be conducted in two positions to distinguish between lesions and residue and locate lesions buried in residue. During this study, for the first time, we evaluated the sensitivity for each patient in terms of the detection performance of an AI algorithm by integrating detection in the supine and prone positions. We were able to prove that the sensitivity in two positions were significantly higher than those in one position.
There is no clear consensus regarding the treatment of lesions 6 to 9 mm [25]. The incidence of lesions 6 to 9 mm for patients at average risk, those with advanced adenoma, and those with invasive cancer were 9.1%, 6.6%, and 0.2% [26]. In terms of cost-effectiveness, a colonoscopy is not recommended for all patients; however, the diagnostic ability of CT colonography remains problematic. During this study, the sensitivity for lesions 6 to 10 mm for each CT series was low when compared to that for lesions ≥10 mm; however, the sensitivity for lesions 6 to 10 mm for each patient in two positions was significantly higher. It has been suggested that imaging in two positions could result in improved sensitivity in detecting lesions.
Reducing false positives in medical imaging is particularly challenging. This is due to the ambiguous boundaries between lesions and normal tissues and the high variability in morphology. Therefore, excessive reduction of false positives may increase the risk of false negatives and place a greater burden on the process of verifying false negatives. Thus, it is essential to implement measures that maintain a clinically acceptable balance, and this remains an issue for future research. However, considering the fact that the sensitivity per patient, which integrates the evaluations in two positions, was better than the sensitivity for images in one position even if the allowed number of FP lesions was the same, it is predicted that developing an algorithm that integrates the results in two positions will improve the sensitivity. Additionally, if pretreatment is also conducted as rigorously as it is during accuracy validation studies, then the sensitivity will be high even if the number of FP lesions is set to a low value; however, the acceptability of the test becomes lower. Therefore, combining low-dose pretreatment and imaging in two positions to determine the diagnosis will be useful. Because of the shortage of radiologists responsible for CT colonography, using deep learning-based CAD for the auxiliary diagnosis will compensate for the weaknesses of CT colonography and promote its use.
Many conventional CAD approaches have involved machine learning of human-designed features. However, there are limits to how humans can design features. Furthermore, because of the focus on the detection of spherical polyps, it has been difficult to understand the features of advanced cancers, which have diverse shapes and are difficult to describe. Deep learning does not require humans to design features, and appropriate preparation of a training dataset enables the detection of advanced cancers with diverse shapes.
This study targeted lesions including advanced cancers. As a result, the validation results showed that the external validation dataset successfully detected lesions ≥10 mm with high sensitivity (>80%). Validation of the lesion detection algorithm using images was performed with reduced pretreatment. Reduced pretreatment for CT colonography, compared to that for endoscopy, is important for improving acceptability. Studies have evaluated the detection performance with images with reduced pretreatment using CAD, but this is the first large-scale study on detection sensitivity using only deep learning-based AI. In the previous study using CAD [27], the sensitivity for detecting adenomas measuring 6 mm or more was 0.59. In contrast, our study using deep learning-based AI demonstrated improved sensitivity, achieving 0.815 for internal validation with single-position imaging and 0.755 and 0.729 for external validation integrating two-position imaging. Additionally, the sensitivity for small lesions measuring 6 to 10 mm was approximately 60–70% with single-position imaging but was significantly improved when image diagnosis was performed using dual-position imaging.
This study had some limitations. First, we were unable to evaluate the specificity due to the absence of negative cases in the external validation dataset. In future research, we believe it is necessary to conduct validation using a large-scale dataset that includes negative cases, and to evaluate the specificity more accurately along with the sensitivity. Second, this study did not validate how physicians interpreted the lesions identified by the AI algorithm. The sensitivity of the AI algorithm was evaluated based on its ability to detect lesions that were endoscopically confirmed. In future studies, it will be necessary to conduct evaluations that incorporate physicians' diagnoses to more accurately assess the performance of the AI algorithm. Third, we did not examine the threshold value and allowed number of FP lesions during the interpretation of the actual images. Finally, this study did not evaluate the cost-effectiveness or feasibility of implementing dual-position imaging and diagnosis using AI algorithms in real-world clinical settings. Given the current radiologist shortage, cost and operational considerations are particularly important.
CAD using CT colonography data to analyze and integrate images obtained in two positions could improve the sensitivity. The deep learning algorithm that was adopted for the present study can be continued to be developed, and increasing the training data will be expected to further improve the sensitivity. Furthermore, the adoption of an ensemble algorithm that integrates learning to detect small and large polyps, and performance improvement can be achieved by adding images with low-dose pretreatment, non-uniform intestinal dilatation, or low-dose imaging to the training data. In the future, validation experiments involving radiologists who can interpret images as well as AI to determine the auxiliary diagnosis can reduce the workload of physicians.
Data is provided within the supplementary information files.
- AI:
-
Artificial intelligence
- CAD:
-
Computer-aided detection
- CNN:
-
Convolutional neural network
- CT:
-
Computed tomography
- DICOM:
-
Digital imaging and communications in the medicine
- FP:
-
False-positive
- IoU:
-
Intersection over union
- JANCT:
-
Japanese national CT colonography trial
- RCTC:
-
Reduced-laxative CT colonography
- ReLU:
-
Rectified linear unit
- 3D:
-
Three-dimensional
The authors thank Y. Itai, K. Kaneko and J. Masumoto (FUJIFILM Corporation) for Technical advice and help with AI algorithm, but was not involved in the planning, implementation, analysis, or publication of the study results. The authors also thanks Editage (www.editage.com) for English language editing. And also thank Dr. R Nozaki (Takano Hospital), Dr. T Yasaka (Nagasaki Kamigoto Hospital), Dr. H Kurosawa (Sakakibara Sapia Tower Clinic) and Dr. N Ito (Hachioji Clinic) for advicing the study design.
No funds were received in support of this work. Technical support and help were provided by FUJIFILM Corporation, so no funding was required.
The research related to human use has been complied with all the relevant national regulations, institutional policies and in accordance the tenets of the Helsinki Declaration, and has been approved by the institutional review board of Fukushima Medical University (2019-177). Informed consent was waived by Fukushima Medical University Ethics committee because of retrospective nature of the study.
Not applicable.
The authors declare no competing interests.
Springer Nature remains neutral with regard to jurisdictional claims in published maps and institutional affiliations.
Open Access This article is licensed under a Creative Commons Attribution-NonCommercial-NoDerivatives 4.0 International License, which permits any non-commercial use, sharing, distribution and reproduction in any medium or format, as long as you give appropriate credit to the original author(s) and the source, provide a link to the Creative Commons licence, and indicate if you modified the licensed material. You do not have permission under this licence to share adapted material derived from this article or parts of it. The images or other third party material in this article are included in the article’s Creative Commons licence, unless indicated otherwise in a credit line to the material. If material is not included in the article’s Creative Commons licence and your intended use is not permitted by statutory regulation or exceeds the permitted use, you will need to obtain permission directly from the copyright holder. To view a copy of this licence, visit http://creativecommons.org/licenses/by-nc-nd/4.0/.

Endo, S., Nagata, K., Utano, K. et al. Development and validation of computer-aided detection for colorectal neoplasms using deep learning incorporated with computed tomography colonography. BMC Gastroenterol 25, 149 (2025). https://doi.org/10.1186/s12876-025-03742-0
Received:
Accepted:
Published:
DOI: https://doi.org/10.1186/s12876-025-03742-0