BMC Health Services Research volume 25, Article number: 829 (2025) Cite this article
AbstractSection Background
Hypertension is a leading cause of morbidity and mortality, affecting 48% of US adults, with nearly three quarters of them remaining uncontrolled. Despite evidence-based guidelines for the management of hypertension, gaps persist in their clinical application. The aim of this study was to improve blood pressure control rates among nonpregnant adult patients in primary care.
AbstractSection Methods
We applied the Agile Implementation process to address barriers to guideline implementation. Using an iterative quality improvement approach, we implemented the AI process in a clinic serving minority and underserved populations from January 2023 to December 2023.
AbstractSection Results
The AI process increased hypertension control rates from 43 to 58%, using a target blood pressure below 140/90 mmHg.
AbstractSection Conclusions
The AI process effectively improved hypertension control rates in an underserved primary care setting, offering a scalable approach for enhancing outcomes in similar populations.
Hypertension is a major modifiable risk factor for morbidity and mortality [1, 2]. In the United States, almost 50% of adults have hypertension, defined as systolic BP ≥ 130 mm Hg, diastolic BP ≥ 80 mm Hg, or self-reported antihypertensive medication use [3, 4]. Hypertension prevalence is highest among non-Hispanic black adults (57%) compared to non-Hispanic whites (44%) [3].
In 2019, there were 56.8 million annual office visits where hypertension was the primary diagnosis [5], and in 2021, 1.3 million visits to emergency departments were due primarily to essential hypertension [6]. Despite the substantial burden of this disease, it is estimated that only 22.5% nonpregnant US adults have achieved controlled blood pressure (BP < 130/80 mmHg) [3]. In response to this critical health issue, the Office of the Surgeon General emitted a call to action in 2020, emphasizing effective hypertension management as a national health priority to mitigate its adverse health impacts [7].
A widely recognized problem in healthcare delivery is the significant gap between evidence-based recommendations and their implementation in clinical practice [8]. The average time to implement evidence-based practices (EBP) is estimated to be around 15 years [9]. Explanations for this gap include providers’ perception that the recommended EBP may not be applicable to complex patients, time constraints, and lack of incentives and demand from their healthcare system [10].
Implementation science has developed processes to overcome these barriers and facilitate implementation of EBP in real-world settings. One such example is Agile Science, in particular the Agile implementation (AI) process, which was developed at the Indiana University Center for Health Innovation and Implementation Science (CHIIS). Agile science provides a structured framework for implementation that incorporates behavioral economics principles, using ‘nudges’ to influence individual behavior, without eliminating choice, tailored for the specific organization and setting [11, 12].
Therefore, this study aims to evaluate the effectiveness of the AI process in enhancing blood pressure control rates among nonpregnant adult patients in a primary care setting.
This quality improvement (QI) study was conducted at an Indiana University Health primary care residency clinic located in a health professional shortage area, with an Area Deprivation Index (ADI) National Percentile of 66. Serving a patient population of 18,000 individuals, the clinic’s demographics comprises 50% Medicaid, 13% Medicare, 13% commercial insurance, and 17% self-pay patients. Racial minorities make up 58.5% of the patient population, including 51.4% Black/African American and 7.1%, Hispanic individuals.
The initiative took place from February to December 2023. During this time 71 clinicians practiced at the clinic, including 17 faculty physicians, 3 advanced practice providers, 37 family medicine resident physicians, and 15 transitional year residents.
We utilized AI process as the model for improvement due to its capacity for rapid implementation and sustainable integration of evidence-based healthcare interventions [13, 14]. The eight steps of the AI process, outlined in Supplementary Material 1, are described below.
Identify opportunities
The initial step involves identifying opportunities for improvement and ensuring that time, personnel, and resources are available. Our team utilized the Project Demand Score, which evaluates six domains, each assigned a different weight based on relevance (Supplementary Material 2). A Project Demand Score of 82.5%, corresponding to a grade B, qualified our project for selection. This step also involved meetings with population health teams and participation in the iHeart program, a community health initiative aimed at reducing hypertension rates in low-income and high socio-economic need areas of Indianapolis. This program provides funding for community health workers embedded in pilot practices, where they assist patients in managing their hypertension in an ambulatory setting while addressing non-urgent social needs.
Additionally, we established a team of clinic champions, comprising three faculty physicians, one medical assistant, the practice administrator, and practice manager, to lead the clinic-wide implementation effort. This team represented 8% of the total clinic providers.
Select an evidence-based solution
The second step requires the team to identify an evidence-based solution by consulting published studies, guidelines, and recommendations. For this initiative, we followed the evidence-based recommendation outlined in the 2017 Guideline for the Prevention, Detection, Evaluation, and Management of High Blood Pressure in Adults by the American College of Cardiology/American Heart Association Task Force [4].
Develop evaluation and termination plan
The third step includes the definition of milestones (leading measures), outcome measures (lag measures), and criteria for discontinuing the intervention if unsuccessful. Our aim was to increase the percentage of patients with hypertension under control (BP < 140/90) from 43 to 53% by December 31, 2023. This threshold was selected based on the standard reporting and performance tracking framework used by our population health team. Lead measures included the rate of second blood pressure check and the number of patients enrolled in iHeart Program. Termination criteria were set as a control rate below 50% at nine months, with the decision to be made by our site champion.
Map the process and identify specifications
In the fourth step, the team mapped the current process and identified key specifications of the evidence-based solution, adapted to our unique setting as ‘minimally viable product or service’ (MVP). We mapped the process, identified potential interventions areas, and presented the problem at an Agile Innovation Forum, posing the question: “How can we nudge providers and clinic staff to improve blood pressure control in a primary care setting?” As part of localizing the guidelines, and to align with population health reporting standards, we established a blood pressure target of less than 140/90.
Execute implementation sprints
Step five involved conducting “sprints” or time-bound implementation cycles to test the minimal viable specifications identified earlier. Each sprint lasted approximately four weeks, allowing for evaluation and adaptation based on performance data. If an intervention contributed to improved blood pressure control rates, it was adopted and continued.
Key interventions tested during these sprints included obtaining a second blood pressure reading when the initial measurement was elevated, relocating the BP check from the vital signs station to the patient’s exam room, implementing a visual nudge to alert providers to elevated readings, and enrolling patients in home BP monitoring with a secure text messaging system. The text messaging system allowed patients to submit home BP readings, which were automatically integrated into the electronic medical record (EMR) and included in monthly reports if they were the most recent BP measurement. Finally, the clinical pharmacy team conducted phone consultations for patients with at least two home blood pressure readings > 140/90 mmHg to assess medication adherence. If adherence was confirmed, they could adjust antihypertensive medication doses and schedule follow-up appointments.
Monitor system performance
In Step six, system performance was monitored using the predefined leading and lagging measures. Leading measures included the rate of second BP checks performed, the number of patients enrolled in the iHeart program, and home BP monitoring engagement. The primary lagging measure was the clinic-wide BP control rate (BP < 140/90 mmHg).
Assess organizational impact
In step seven, the team assessed the intervention’s broader impact on the organization, considering both positive and negative unintended consequences.
Develop standard operating procedure
In step eight, once goals were met, standardized operating procedures (SOP) were created to replicate the solution at other different sites. By following these steps, the Agile Implementation process allows for iterative testing, real-time performance monitoring, and the development of sustainable solutions, ensuring that interventions are both effective and adaptable for broader application across various sites [11].
Key measures
The primary outcome for this initiative was the proportion of nonpregnant adults diagnosed with hypertension who achieve a blood pressure reading below 140/90 during any type of clinic visit. Additionally, the number of uncontrolled patients receiving a follow-up blood pressure reading was tracked as a process measure.
Sampling
All adult patients who attended a visit to our clinic during the study period were included in the initiative, resulting in a cumulative total of 18,500 reviewed visits.
Design and methodology
We conducted a quality improvement initiative, collecting baseline data from the two months preceding the intervention. BP control rates were continuously tracked throughout the intervention and during post-intervention period using run charts to monitor trends and assess changes over time.
Run chart analysis identified non-random patterns using three probability-based rules: shifts, trends, and runs. A shift occurred when six or more consecutive points fell entirely above or below the median, excluding points that fell on the median. A trend was present when five or more consecutive points moved consistently upward or downward, disregarding repeated values. A run was a sequence of consecutive points on one side of the median, where deviations from the expected number of runs–either too few or too many runs– suggested non-random variation, potentially indicating an intervention effect. The number of runs was calculated by counting how often the line connecting data points crossed the median, plus one. Statistical significance was assessed using a reference table of critical values for expected runs based on the number of data points [15]. This structured approach objectively detected process changes and distinguished true signals from random variation.
Outcome measures
The primary outcome was the percentage of hypertensive patients achieving a blood pressure below 140/90. Post-implementation sustainability was assessed by analyzing follow-up data to determine the long-term effectiveness of the intervention.
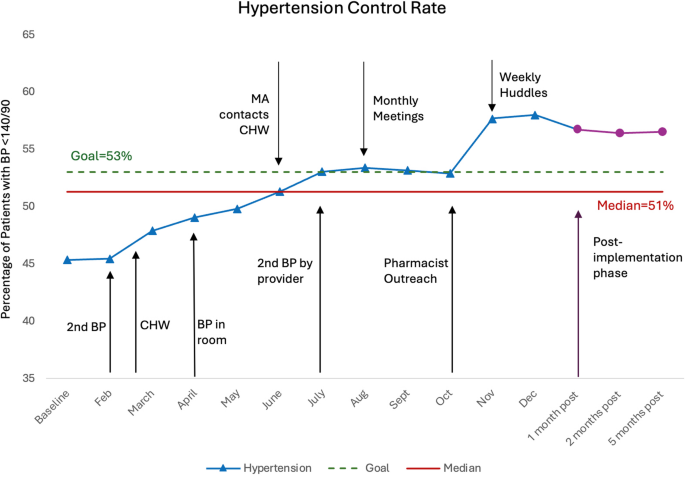
Implementation sprints began in February 2023. Initially, medical assistants (MAs) measured blood pressure at designated stations during the rooming process. A key issue identified was the lack of repeat BP measurements when the initial reading was elevated. To address this, an improvement cycle tasked MAs with repeating the measurements and writing the BP reading on the white door as a visual cue. This was intended to nudge both MAs and providers to address the abnormal readings. However, these interventions were not followed by a notable increase in blood pressure control rates.
In a subsequent sprint, initial BP checks were relocated from the vital signs station to the patient exam rooms, providing a quieter environment and allowing patients to sit comfortably before measurement. This change, combined with visual nudges (writing the BP on the board), was followed by an increased control rate from 44 to 49%. Additionally, in March, a Community Health Worker (CHW) position was introduced as part of the iHeart program to distribute blood pressure monitors and enroll patients in a secure text messaging system, which launched in June. Initially, MAs referred patients to the CHW, but the added workload proved unsustainable. To improve efficiency, the process shifted to provider-initiated referrals. Referrals to the CHW ranged from 3 to 23 per month, with a maximum of 13 BP monitors provided per month. After the text messaging system launched in June, enrollment averaged 7 patients per month.
Subsequent sprints included repeat BP by the providers, monthly clinic-wide meetings (comprising the population health team, CHW, staff, faculty and resident providers and pharmacist), and pharmacy phone consultations for patients with uncontrolled home BP.
The core team (CHW, practice administrator, medical director and clinician champions) increased meeting frequency to weekly 15-minute sessions, reviewing progress on hypertension control, BP measurements, and identifying successful and unsuccessful strategies, and potential improvements. Feedback and process changes were communicated with the broader team during huddles, meetings, and through group text messages.
At baseline, the HTN control rate was 43%. The implementation of a second BP check was followed by a slight increase. In April, a significant process change occurred, involving initial BP measurement in patient rooms, coincided with an increase in the control rate to 49%. Control rates remained below 50% until a sprint focused on outreach to patients with elevated home BP readings by the clinical pharmacy team, after which control rates surpassed the target (at 57%). The following sprint, in which the core team increased meeting frequency to weekly, was followed with a control rate of 58%.
The presence of a shift (six or more consecutive points above the median), a trend (five or more consecutive points all increasing), and fewer runs than anticipated, as indicated by tabled critical values, suggested non-random variation within the process [15]. At 1,2, and 5 months, during the sustainability period, the screening rate remained at 56%, significantly higher than the baseline (Fig. 1).
By leveraging the Agile Implementation process, our team achieved a 58% HTN control rate, a 14% increase, impacting approximately 574 patients in an underserved primary care setting. Although this rate falls short of population health targets, it underscores the efficacy of our approach.
In the year prior to the implementation, hypertension control rates averaged 45.7% and declined throughout the year, reaching a low of 43.6%. In contrast, during the implementation period, control rates increased, suggesting a likely association with the initiative.
Key factors contributing to this outcome included the active stakeholder engagement; continuous learning; the establishment of psychological safety, which encouraged experimentation during sprints; clear evaluation and termination criteria; and regular accountability meetings.
This success aligns with challenges identified in the literature, which emphasize the complexity of managing HTN in primary care. Key issues include discrepancies between office and out-of-office BP readings [16]; medication adherence [17]; and therapeutic inertia [18,19,20]. Evidence supports that home BP monitoring, combined with medication titration as effective strategies for BP reduction [21]. Effective implementation, therefore, is essential for optimizing team-based care and improving patient outcomes.
To support sustainability, we developed a standardized operating procedure (SOP) with streamlined workflows and expanded team roles to support primary care providers. This SOP will serve as a model for future implementation in primary care settings (Table 1). To further enhance control rates and reduce healthcare disparities, future steps should focus on comprehensive hypertension management, including medication titration, while ensuring the long-term feasibility of these interventions in primary care workflows.
While our approach yielded positive results, limitations remain. We did not account for patients with normal office BP readings who might have masked hypertension. Additionally, we lacked data on pharmacist-led medication management, follow-up appointments, or referrals for uncontrolled patients, limiting our ability to assess these interventions fully. Future studies should address these gaps to provide a more comprehensive evaluation.
The Agile Implementation process led to improved blood pressure control in our underserved academic primary care clinic. These findings highlight the importance of customized workflows, active stakeholder engagement, and iterative improvements in the implementation of health care interventions. Such insights can continue to inform efforts to enhance hypertension management in primary care settings, ultimately benefiting patient outcomes and reducing the burden on healthcare providers.
The data that support the findings of this study are available on request from the corresponding author, DS.
- AI:
-
Agile Implementation
- BP:
-
Blood Pressure
- CHIIS:
-
Center for Health Innovation and Implementation Science
- CHW:
-
Community Health Workers
- EBP:
-
Evidence-based practices
- MA:
-
Medical Assistant
Not applicable.
This project was not funded.
This study was conducted as a quality improvement initiative aimed at enhancing hypertension control within a primary care setting. Following the review by the Indiana University Human Research Protection Program (Protocol #: 24878), the project was determined to be Not Human Subjects Research. Consequently, Internal Review Board (IRB) review was not required, and the need for participant consent was deemed unnecessary. In addition, no patient-identifiable information was collected or analyzed, ensuring compliance with ethical standards for quality improvement initiatives.
Not applicable.
The authors declare no competing interests.
Springer Nature remains neutral with regard to jurisdictional claims in published maps and institutional affiliations.
Open Access This article is licensed under a Creative Commons Attribution-NonCommercial-NoDerivatives 4.0 International License, which permits any non-commercial use, sharing, distribution and reproduction in any medium or format, as long as you give appropriate credit to the original author(s) and the source, provide a link to the Creative Commons licence, and indicate if you modified the licensed material. You do not have permission under this licence to share adapted material derived from this article or parts of it. The images or other third party material in this article are included in the article’s Creative Commons licence, unless indicated otherwise in a credit line to the material. If material is not included in the article’s Creative Commons licence and your intended use is not permitted by statutory regulation or exceeds the permitted use, you will need to obtain permission directly from the copyright holder. To view a copy of this licence, visit http://creativecommons.org/licenses/by-nc-nd/4.0/.
Summanwar, D., Mingo, P.T., Wilson, T.K.D. et al. Agile implementation for hypertension control in primary care. BMC Health Serv Res 25, 829 (2025). https://doi.org/10.1186/s12913-025-12941-0
Received:
Accepted:
Published:
DOI: https://doi.org/10.1186/s12913-025-12941-0


