Shareholders in Yamaha (TSE:7951) are in the red if they invested five years ago
Ideally, your overall portfolio should beat the market average. But even the best stock picker will only win with some selections. So we wouldn't blame long term (TSE:7951) shareholders for doubting their decision to hold, with the stock down 45% over a half decade. Furthermore, it's down 16% in about a quarter. That's not much fun for holders.
It's worthwhile assessing if the company's economics have been moving in lockstep with these underwhelming shareholder returns, or if there is some disparity between the two. So let's do just that.
While the efficient markets hypothesis continues to be taught by some, it has been proven that markets are over-reactive dynamic systems, and investors are not always rational. One flawed but reasonable way to assess how sentiment around a company has changed is to compare the earnings per share (EPS) with the share price.
During the five years over which the share price declined, Yamaha's earnings per share (EPS) dropped by 15% each year. The share price decline of 11% per year isn't as bad as the EPS decline. So the market may previously have expected a drop, or else it expects the situation will improve.
You can see below how EPS has changed over time (discover the exact values by clicking on the image).
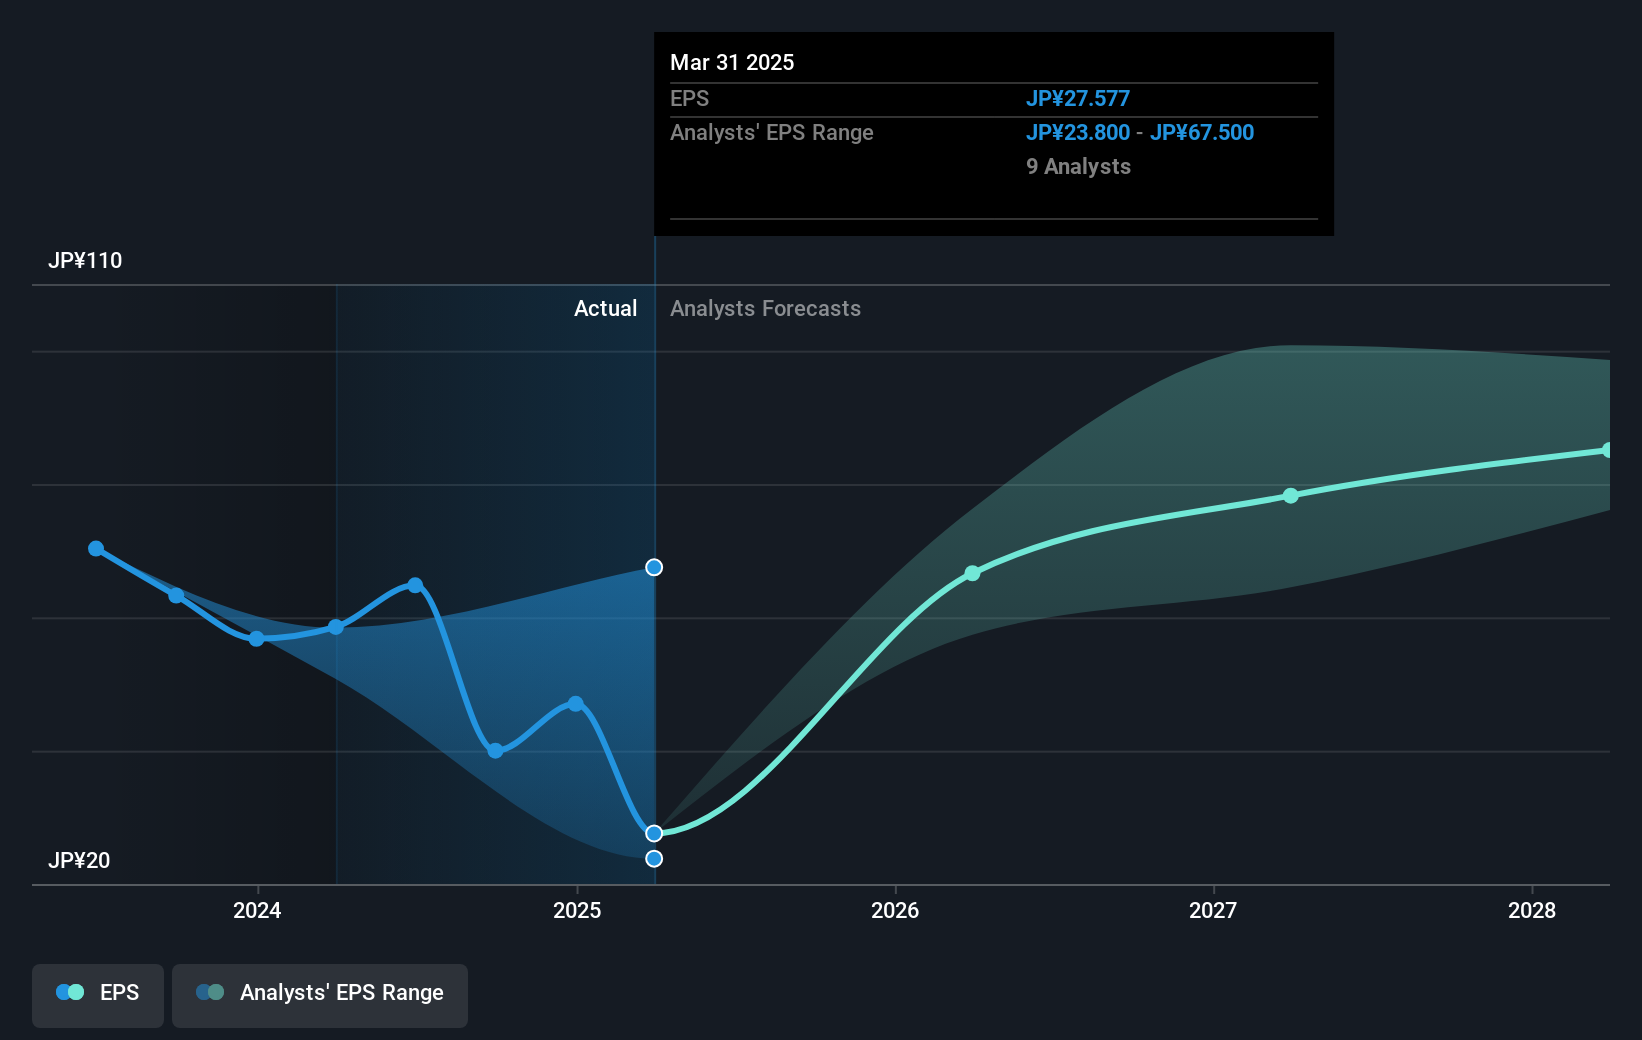
Dive deeper into Yamaha's key metrics by checking this interactive graph of Yamaha's earnings, revenue and cash flow.
As well as measuring the share price return, investors should also consider the total shareholder return (TSR). Whereas the share price return only reflects the change in the share price, the TSR includes the value of dividends (assuming they were reinvested) and the benefit of any discounted capital raising or spin-off. It's fair to say that the TSR gives a more complete picture for stocks that pay a dividend. In the case of Yamaha, it has a TSR of -40% for the last 5 years. That exceeds its share price return that we previously mentioned. This is largely a result of its dividend payments!
While the broader market gained around 3.7% in the last year, Yamaha shareholders lost 19% (even including dividends). However, keep in mind that even the best stocks will sometimes underperform the market over a twelve month period. Unfortunately, last year's performance may indicate unresolved challenges, given that it was worse than the annualised loss of 7% over the last half decade. Generally speaking long term share price weakness can be a bad sign, though contrarian investors might want to research the stock in hope of a turnaround. It's always interesting to track share price performance over the longer term. But to understand Yamaha better, we need to consider many other factors. Even so, be aware that Yamaha is showing , you should know about...
We will like Yamaha better if we see some big insider buys. While we wait, check out this list of undervalued stocks (mostly small caps) with considerable, recent, insider buying.
Please note, the market returns quoted in this article reflect the market weighted average returns of stocks that currently trade on Japanese exchanges.
We've created the for stock investors,
• Connect an unlimited number of Portfolios and see your total in one currency
• Be alerted to new Warning Signs or Risks via email or mobile
• Track the Fair Value of your stocks
with us directly. Alternatively, email editorial-team (at) simplywallst.com.
This article by Simply Wall St is general in nature. We provide commentary based on historical data and analyst forecasts only using an unbiased methodology and our articles are not intended to be financial advice. It does not constitute a recommendation to buy or sell any stock, and does not take account of your objectives, or your financial situation. We aim to bring you long-term focused analysis driven by fundamental data. Note that our analysis may not factor in the latest price-sensitive company announcements or qualitative material. Simply Wall St has no position in any stocks mentioned.