Does Tokyo Seimitsu (TSE:7729) Have A Healthy Balance Sheet?
Legendary fund manager Li Lu (who Charlie Munger backed) once said, 'The biggest investment risk is not the volatility of prices, but whether you will suffer a permanent loss of capital.' It's only natural to consider a company's balance sheet when you examine how risky it is, since debt is often involved when a business collapses. Importantly, (TSE:7729) does carry debt. But the more important question is: how much risk is that debt creating?
Debt assists a business until the business has trouble paying it off, either with new capital or with free cash flow. In the worst case scenario, a company can go bankrupt if it cannot pay its creditors. However, a more common (but still painful) scenario is that it has to raise new equity capital at a low price, thus permanently diluting shareholders. By replacing dilution, though, debt can be an extremely good tool for businesses that need capital to invest in growth at high rates of return. When we examine debt levels, we first consider both cash and debt levels, together.
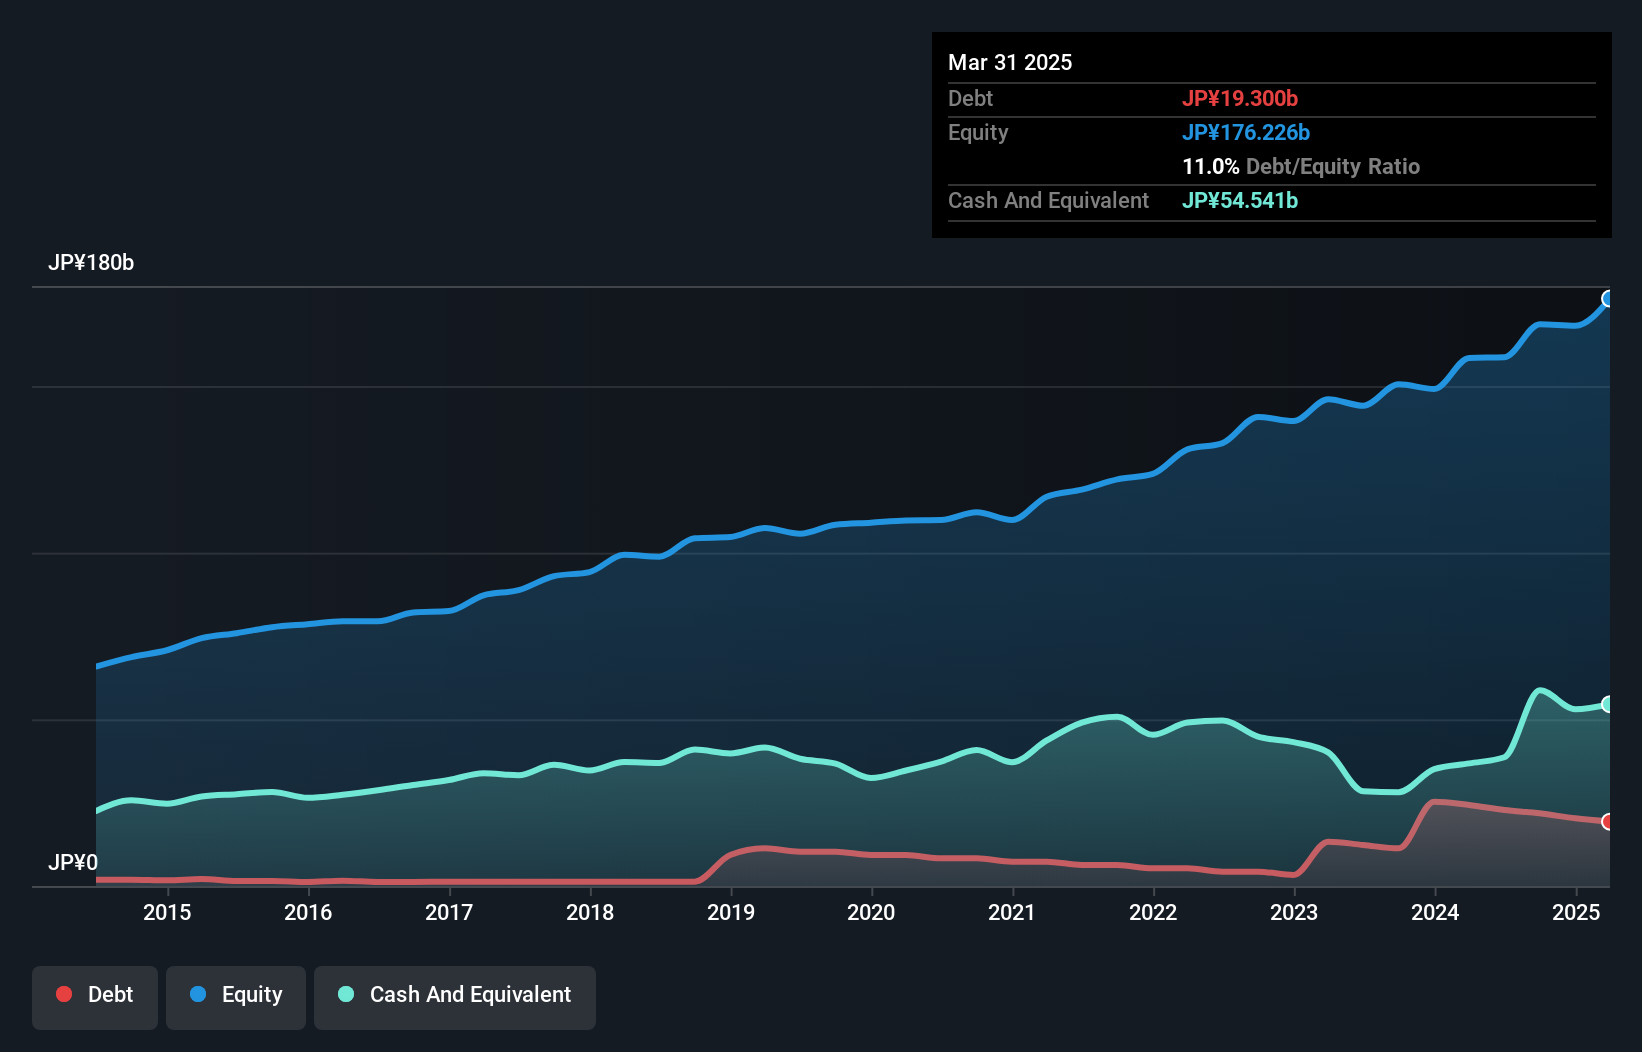
As you can see below, Tokyo Seimitsu had JP¥19.3b of debt at March 2025, down from JP¥24.3b a year prior. But it also has JP¥54.5b in cash to offset that, meaning it has JP¥35.2b net cash.
Zooming in on the latest balance sheet data, we can see that Tokyo Seimitsu had liabilities of JP¥46.9b due within 12 months and liabilities of JP¥14.8b due beyond that. Offsetting these obligations, it had cash of JP¥54.5b as well as receivables valued at JP¥39.8b due within 12 months. So it can boast JP¥32.6b more liquid assets than total liabilities.
This surplus suggests that Tokyo Seimitsu has a conservative balance sheet, and could probably eliminate its debt without much difficulty. Succinctly put, Tokyo Seimitsu boasts net cash, so it's fair to say it does not have a heavy debt load!
See our latest analysis for Tokyo Seimitsu
Also good is that Tokyo Seimitsu grew its EBIT at 17% over the last year, further increasing its ability to manage debt. There's no doubt that we learn most about debt from the balance sheet. But it is future earnings, more than anything, that will determine Tokyo Seimitsu's ability to maintain a healthy balance sheet going forward. So if you want to see what the professionals think, you might find this free report on analyst profit forecasts to be interesting.
Finally, a company can only pay off debt with cold hard cash, not accounting profits. While Tokyo Seimitsu has net cash on its balance sheet, it's still worth taking a look at its ability to convert earnings before interest and tax (EBIT) to free cash flow, to help us understand how quickly it is building (or eroding) that cash balance. In the last three years, Tokyo Seimitsu created free cash flow amounting to 5.1% of its EBIT, an uninspiring performance. That limp level of cash conversion undermines its ability to manage and pay down debt.
While it is always sensible to investigate a company's debt, in this case Tokyo Seimitsu has JP¥35.2b in net cash and a decent-looking balance sheet. And we liked the look of last year's 17% year-on-year EBIT growth. So we are not troubled with Tokyo Seimitsu's debt use. The balance sheet is clearly the area to focus on when you are analysing debt. However, not all investment risk resides within the balance sheet - far from it. For example, we've discovered that you should be aware of before investing here.
If you're interested in investing in businesses that can grow profits without the burden of debt, then check out this list of growing businesses that have net cash on the balance sheet.
Discover if Tokyo Seimitsu might be undervalued or overvalued with our detailed analysis, featuring
Alternatively, email editorial-team (at) simplywallst.com.
This article by Simply Wall St is general in nature. We provide commentary based on historical data and analyst forecasts only using an unbiased methodology and our articles are not intended to be financial advice. It does not constitute a recommendation to buy or sell any stock, and does not take account of your objectives, or your financial situation. We aim to bring you long-term focused analysis driven by fundamental data. Note that our analysis may not factor in the latest price-sensitive company announcements or qualitative material. Simply Wall St has no position in any stocks mentioned.