Cross Border Payments Market Report 2025-2030, with
Dublin, July 01, 2025 (GLOBE NEWSWIRE) -- The "Cross Border Payments Market Size, Share & Trends Analysis Report by Transaction Type (B2B, C2B, B2C, C2C), Channel (Bank Transfer, Money Transfer Operator, Card Payment), Enterprise Size, End-use, and Region with Growth Forecasts, 2025-2030" report has been added to offering.
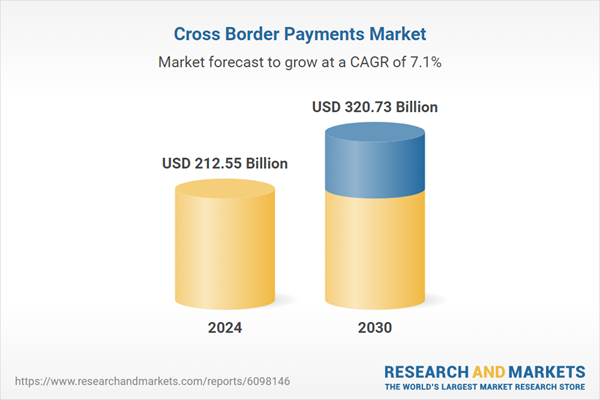
The Cross Border Payments Market was valued at USD 212.55 billion in 2024, and is projected to reach USD 320.73 billion by 2030, rising at a CAGR of 7.10%. Cross-border payments remain high-cost and slow, driving reforms.
The World Bank reports an average cost of about 6.2-6.3% for sending USD 200 in 2023, far above the 3% Sustainable Development Goal. Even within regions, costs vary widely. For example, the World Bank notes remittance fees to South Asia averaged 6-7% in 2023, while fees into Africa often exceed 7%. These inefficiencies are due to multiple correspondent steps and manual checks, which have prompted G20/FSB initiatives setting targets for "faster, cheaper, more transparent, and more inclusive" cross-border payments. Central banks and institutions are analyzing corridor-level fees (e.g., Turkey-Bulgaria at >50%) and tracking progress on G20 Roadmap goals. In short, reducing friction and costs is a major trend. International bodies like the IMF and FSB stress lowering remittance and trade payment fees as a priority.
To meet cost/speed goals, industries are upgrading systems. The adoption of the ISO 20022 messaging standard for payments is accelerating. Another modernization is real-time payment connectivity; more than 70 national fast-payment systems (FPS) now operate worldwide, and interlinking them is seen as highly promising. This states that the cross-border linking of FPS enables near-instant transfers between countries. In sum, upgrading rails and messaging (ISO?20022, RTGS/FPS interlinking) is a key trend driving the growth of the cross border payments industry, backed by central bank initiatives and FSB/CPMI guidance.
Central banks and the private sector are actively exploring digital currencies. The Federal Reserve notes that over 90% of central banks are researching Central Bank Digital Currencies (CBDCs), and pilot projects are underway in many jurisdictions. CBDCs, in theory, provide new secure settlement rails for cross-border flows. Alongside CBDCs, interest in stablecoins and tokenized payments is rising, though official bodies urge caution. The stablecoins are considered a "future scenario" for cross-border payments, but none yet meet regulatory standards. Some jurisdictions (China, some EMDEs) are actively piloting stablecoin or digital yuan cross-border use, while others (e.g. EU) regulate stablecoins tightly to safeguard financial stability. In practice, digital innovation from blockchain-based remittance networks to cross-border mobile money is a major focus, even as policymakers work to align regulations internationally.
Addressing cross-border frictions has become a global priority. In late 2024, the FSB launched a Forum on Cross-Border Payments Data to align regulations and data frameworks across jurisdictions. The Forum will tackle issues like inconsistent KYC/AML requirements and data privacy rules that slow payments. For example, the Bank of England highlights that mismatched compliance rules cause payouts to stall at beneficiary banks. The FSB forum (Mar 2025) and CPMI guidance aim to harmonize these standards. In essence, a trend is greater global coordination, G20/FSB roadmaps, OECD, and FATF work, and shared guidance are being developed so that cross-border chains are smoother and more interoperable.
Cross-border payments aren't just big banks and corporations - consumer use is exploding. Remittance alone was around USD 669 billion to developing countries in 2023, and money sent via online platforms and mobile wallets is growing. The World Bank reports that remittances now exceed the sum of foreign direct investment and foreign aid for many countries. This underlines financial inclusion as a driver, migrants and diaspora rely on efficient remittances.
At the same time, cross-border e-commerce and travel drive consumer-to-business (C2B) payments worldwide. The Bank of England notes that cross-border payments span wholesale and retail (including person-to-person and person-to-business) and are integral as goods/services flow globally. Overall, expanding volume and diversity of cross-border transactions from gig economy transfers to SME trade payments is a key trend prompting service innovation and boosting market growth.
This report forecasts revenue growth at the global, regional, and country levels and provides an analysis of the latest industry trends in each of the sub-segments from 2018 to 2030. For this study, the analyst has segmented the global cross border payments market report based on transaction type, channel, enterprise size, end use, and region.
The major companies featured in this Cross Border Payments market report include:
| No. of Pages | 130 |
| Forecast Period | 2024 - 2030 |
| Estimated Market Value (USD) in 2024 | $212.55 Billion |
| Forecasted Market Value (USD) by 2030 | $320.73 Billion |
| Compound Annual Growth Rate | 7.1% |
| Regions Covered | Global |
2.1. Market Outlook
2.2. Segment Outlook
2.3. Competitive Insights
3.1. Market Lineage Outlook
3.2. Market Dynamics
3.3. Cross Border Payments Market Analysis Tools
3.3.1. Industry Analysis - Porter's
3.3.2. PESTEL Analysis
4.1. Segment Dashboard
4.2. Cross Border Payments Market: Transaction Type Movement Analysis, 2024 & 2030 (USD Million)
4.3. Business to Business (B2B)
4.4. Customer to Business (C2B)
4.5. Business to Customer (B2C)
4.6. Customer to Customer (C2C)
5.1. Segment Dashboard
5.2. Cross Border Payments Market: Channel Movement Analysis, 2024 & 2030 (USD Million)
5.3. Bank Transfer
5.4. Money Transfer Operator
5.5. Card Payment
5.6. Others
6.1. Segment Dashboard
6.2. Cross Border Payments Market: Enterprise Size Movement Analysis, 2024 & 2030 (USD Million)
6.3. Large Enterprises
6.4. Small & Medium Enterprises (SMEs)
7.1. Segment Dashboard
7.2. Cross Border Payments Market: End Use Movement Analysis, 2024 & 2030 (USD Million)
7.3. Individuals
7.4. Businesses
8.1. Cross Border Payments Market Share, By Region, 2024 & 2030 (USD Million)
9.1. Company Categorization
9.2. Company Market Positioning
9.3. Company Heat Map Analysis
9.4. Company Profiles
For more information about this report visit https://www.researchandmarkets.com/r/s96gas
About ResearchAndMarkets.com
ResearchAndMarkets.com is the world's leading source for international market research reports and market data. We provide you with the latest data on international and regional markets, key industries, the top companies, new products and the latest trends.