Cardano eyes recovery as it retests key support, funding rate and bullish bets signal optimism
Cardano (ADA) recovers slightly by 4%, trading around $0.70 on Tuesday after falling nearly 7% the previous day. On-chain metrics signal further recovery as ADA’s funding rate turns positive while its bullish bets reach the highest level over a month.
Cardano’s price declined 36.36% last week and continued its pullback on Monday by nearly 7%. At the time of writing on Tuesday, it recovers slightly after retesting its key support level at
$0.64.
The $0.64 level roughly coincides with multiple levels as follows, making it a key reversal zone:
If the abovementioned level holds as support, ADA could extend the recovery to retest its next resistance level at $0.98.
However, the Relative Strength Index (RSI) reads 44, below its neutral level of 50, indicating bearish momentum. The RSI must move above its neutral level of 50 to sustain bullish momentum. Such a development would add a tailwind to a recovery rally.
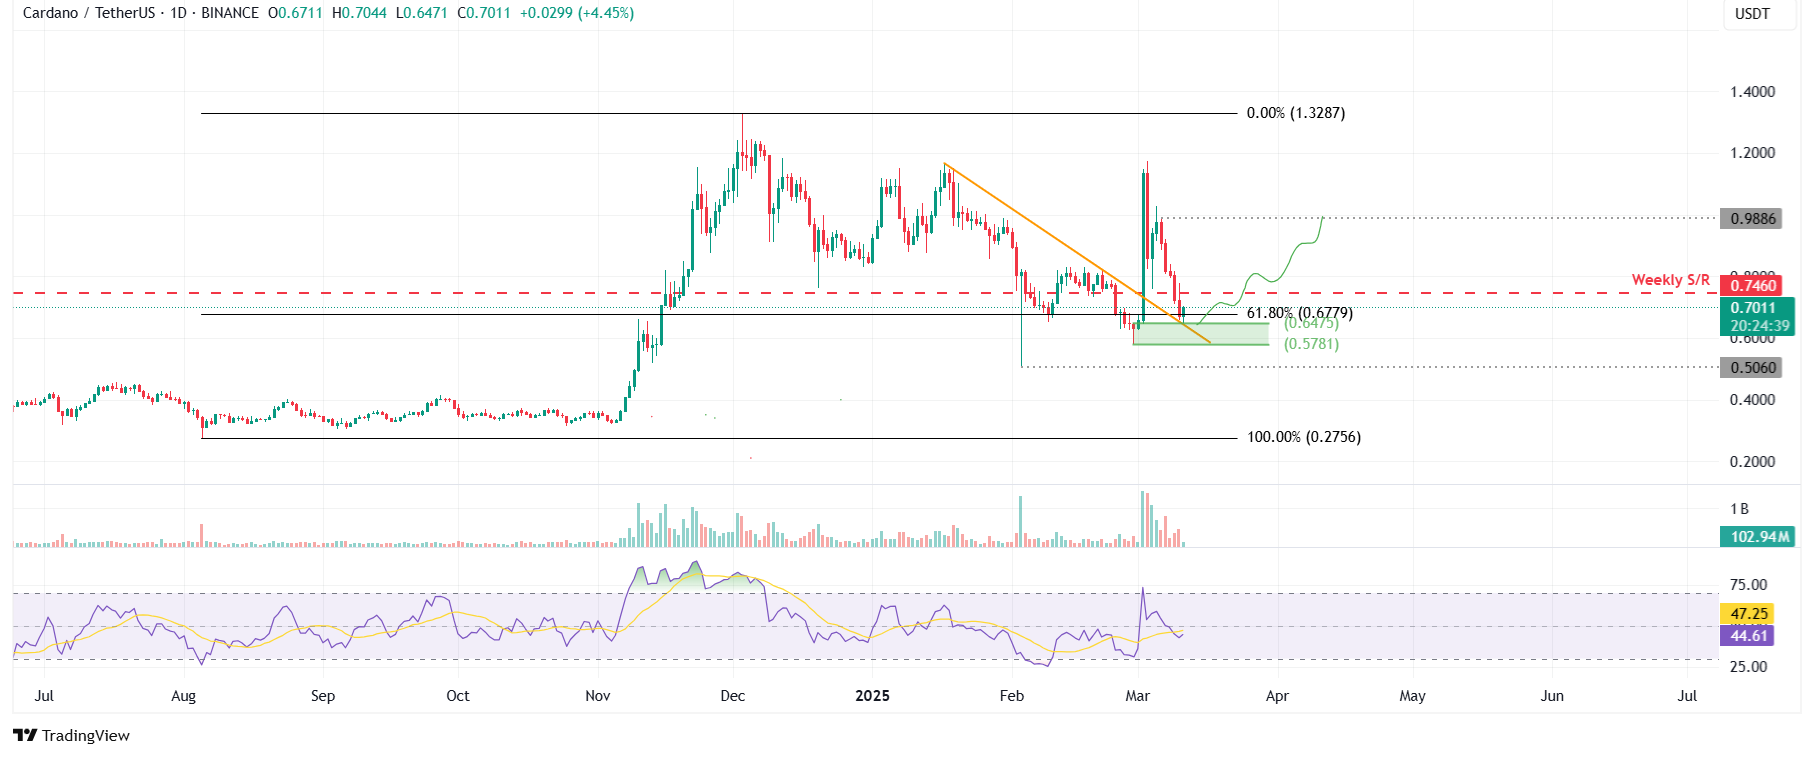
ADA/USDT daily chart
Looking at on-chain metrics supports further recovery. Coinglass data shows ADA’s long-to-short ratio, which reads 1.06, is at its highest level in over a month. This ratio above one reflects bullish sentiment in the markets as more traders are betting on the asset price to rise.
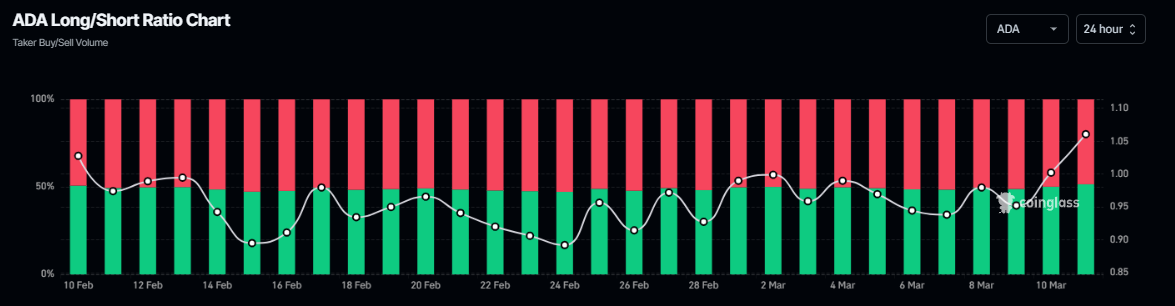
ADA long-to-short ratio chart. Source: Coinglass
According to Coinglass’s OI-Weighted Funding Rate data, the number of traders betting that the price of Cardano will slide further is lower than that anticipating a price increase.
This index is based on the yields of futures contracts, which are weighted by their Open Interest (OI) rates. Generally, a positive rate (longs pay shorts) indicates bullish sentiment, while negative numbers (shorts pay longs) indicate bearishness.
In the case of ADA, this metric reads 0.0007%, reflecting a positive rate and indicating that longs are paying shorts. This scenario often signifies bullish sentiment in the market, suggesting a potential recovery in Cardano’s price.
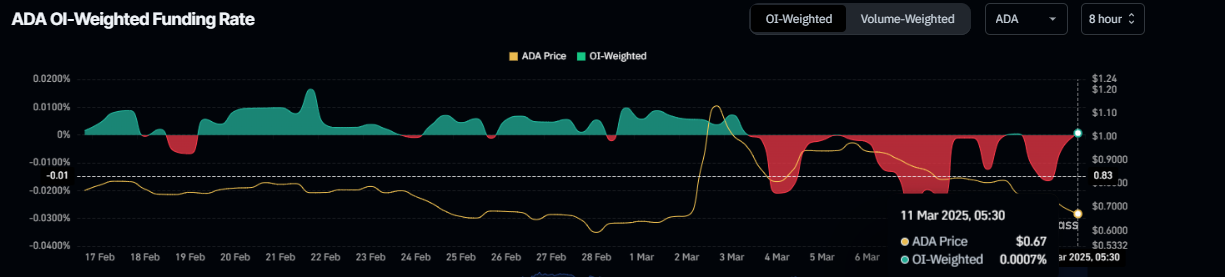
Cardano OI-Weighted Funding Rate chart. Source: Coinglass
Even though on-chain metrics and technical analysis support the bullish outlook, a daily candlestick closes below $0.57 would invalidate the bullish thesis. This development could cause Cardano’s price to decline and retest its next support level at $0.50.
Information on these pages contains forward-looking statements that involve risks and uncertainties. Markets and instruments profiled on this page are for informational purposes only and should not in any way come across as a recommendation to buy or sell in these assets. You should do your own thorough research before making any investment decisions. FXStreet does not in any way guarantee that this information is free from mistakes, errors, or material misstatements. It also does not guarantee that this information is of a timely nature. Investing in Open Markets involves a great deal of risk, including the loss of all or a portion of your investment, as well as emotional distress. All risks, losses and costs associated with investing, including total loss of principal, are your responsibility. The views and opinions expressed in this article are those of the authors and do not necessarily reflect the official policy or position of FXStreet nor its advertisers. The author will not be held responsible for information that is found at the end of links posted on this page.
If not otherwise explicitly mentioned in the body of the article, at the time of writing, the author has no position in any stock mentioned in this article and no business relationship with any company mentioned. The author has not received compensation for writing this article, other than from FXStreet.
FXStreet and the author do not provide personalized recommendations. The author makes no representations as to the accuracy, completeness, or suitability of this information. FXStreet and the author will not be liable for any errors, omissions or any losses, injuries or damages arising from this information and its display or use. Errors and omissions excepted.
The author and FXStreet are not registered investment advisors and nothing in this article is intended to be investment advice.