BioMedical Engineering OnLine volume 24, Article number: 82 (2025) Cite this article
Chronic obstructive pulmonary disease (COPD), a progressively worsening respiratory condition, severely impacts patient quality of life. Early risk assessment can improve treatment outcomes and lessen healthcare burdens. However, current early assessment methods are limited. This study seeks to develop innovative approaches for the early detection and evaluation of COPD.
This study employed a cross-sectional design. Initially, we created a dedicated recording application deployed on smartphones to gather audio data from participants. Following this, each individual completed pulmonary function tests and participated in questionnaire surveys. COPD risk was defined as a pre-bronchodilator FEV1/FVC ratio < 0.7 combined with a history of exposure to risk factors like smoking or biomass fuel. Ultimately, we assessed the feasibility of utilizing smartphones to capture exhalation and cough sounds for the identification of COPD risks through the application of machine learning algorithms.
We gathered valid data from 530 adults, of whom 171 met the criteria for being at risk of COPD. Utilizing the XGBoost algorithm, we achieved a precision of 0.98 and a recall of 0.89.
Our study demonstrates that cough audio signals provide valuable insights for identifying COPD risk, effectively complementing exhalation signals in assessments. This approach is not only feasible and practical for real-world applications, but also offers an affordable and accessible solution, especially beneficial in resource-limited settings.
Chronic obstructive pulmonary disease (COPD), a long-term and progressively worsening respiratory disease, significantly impacts patients’ quality of life. Epidemiological researches suggest that approximately 10.3% of the global population suffers from COPD [1]. According to the most recent data from the Global Burden of Disease project, COPD ranks as the fourth highest cause of death when adjusted for age globally and the sixth for disability-adjusted life-years lost on a worldwide scale [2, 3]. In China, the prevalence of COPD in the population aged 40 years or older is 13.7% [4]. Both domestically and internationally, there is a significant burden of disease associated with COPD. Thus, identifying high-risk groups for COPD, making early diagnoses, and initiating regular treatment are of great significance.
Underdiagnosis of COPD is a significant challenge currently faced globally [5], and this issue is particularly pronounced in resource-limited countries and regions. For instance, the rate of undiagnosed cases can be as high as 89% in Latin America, primarily due to the lack of spirometry testing, which is one of the gold standards for diagnosing COPD by measuring breath volume and flow rate [6]. Similarly, in China, only 12% of COPD patients have undergone spirometry [4]. Spirometry, which measure breath volume and flow rate, are one of the gold standards for diagnosing COPD [1]. However, the complexity of the procedure, the need for specialized technical personnel, and the high cost of equipment have made spirometry a major barrier to adequate diagnosis, especially in primary healthcare settings and in low- and middle-income countries or developing nations [5, 7]. These constraints result in many patients being unable to receive proper diagnosis, leading to missed or mistaken diagnoses of COPD and, consequently, missed opportunities for early treatment. While there have been attempts to reduce the cost and complexity of pulmonary function tests through simplified devices, such as portable spirometers, these methods still face the constraint of requiring the purchase of specific equipment. Moreover, these simplified devices often fail to achieve widespread adoption, particularly in low-income regions.
In recent years, with the advancement of technology, researchers have begun to explore the use of intelligent devices, such as smartphones and wearable devices, for pulmonary function assessment. Nemati et al. proposed for the first time that the physiological mechanisms involved in the coughing process are similar to those in spirometry tests, hence they suggested the use of acoustic features of voluntary coughs to estimate lung obstruction [8]. The cough sounds were collected using the microphone of a smartphone. Chung et al. proposed an application and cloud platform for remote PFT monitoring that can directly measure lung function through a smartphone’s microphone, without the need for external devices [9]. Rahman et al. introduced ExhaleSense, which can detect forced exhalation sounds on smartphones from audio time-series data, differentiate between high-fidelity and low-fidelity sounds, and estimate lung obstruction [10]. Thap et al. utilized the high-resolution time–frequency spectrum of the built-in microphone in smartphones to estimate lung function parameters [11]. Specifically, for the first time, a method based on Variable Frequency Complex Demodulation Method (VFCDM) was proposed to estimate the ratio of forced expiratory volume in one second to forced vital capacity (FEV1/FVC). Mo A et al. suggested using voluntarily cough sounds recorded by smartphones to quickly screen for common lung diseases, including COPD, asthma, and respiratory infections (COVID-19) [12]. Xie et al. proposed EarSpiro, a headphone-based lung function assessment scheme. EarSpiro uses Convolutional Neural Networks (CNN) and Recurrent Neural Networks (RNN) to capture the complex correlation between airflow sounds and airflow speed, thereby estimating four common lung function indicators [13]. In addition, several studies including MobiSpiro [14], SpiroSmart [15], SpiroCall [16], and SpiroConfidence [17] have validated the feasibility of using smartphones for lung function assessment.
The aforementioned smartphone-based assessment methods, due to their portability and user-friendliness, enable patients to perform pulmonary function tests in their homes or any other non-medical settings. The convenience of these tests significantly enhances patients’ ability to monitor their health status continuously, especially in remote or resource-limited settings. In the long run, the widespread adoption of these methods could help to reduce substantial healthcare costs associated with late detection or improper treatment of diseases. However, the current body of research presents four major limitations: (1) the validation data used in these studies are relatively scarce, and there are severe imbalances in the ratios of patients to control subjects. (2) The experiments require additional mouthpiece accessories beyond the smartphone to ensure consistency in the cross-sectional area of the airflow during exhalation. (3) Most studies primarily focus on distinguishing specific diseases from healthy controls. (4) Most research is conducted based on a single type of signal, such as coughing or exhalation. These issues compromise the accuracy and reliability of the research findings. They also limit the potential for exploring the performance of smartphone-based pulmonary function assessment technologies and their broader application.
This study aims to address, to some extent, the limitations present in existing research and further explore the feasibility and value of smartphone-based approaches in the screening for COPD risk. The main contributions of this work are as follows: (1) It proposes that screening efforts for COPD risk should be centered around the use of smartphones, providing a definition for COPD risk. (2) It integrates cough and forced exhalation signals to explore the value of smartphone-based methods in screening for COPD risk. (3) To the best of the authors’ knowledge, this study represents the largest dataset utilized to date in such research.
In this study, a total of 892 participants were recruited. Due to incomplete or missing questionnaire data (89 cases), missing audio data (32 cases), audio data failing to meet quality standards (185 cases), and persistently suboptimal pulmonary function test results (56 cases), only 530 valid cases remained (356 males and 174 females) (Fig. 1). Among these, 171 were identified as being at risk for COPD.
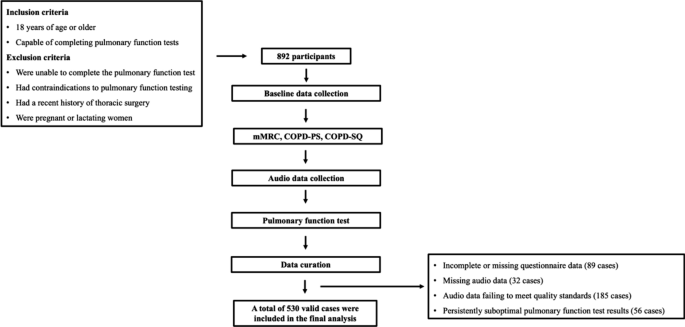
Participant inclusion flowchart in the present study
As shown in Table 1, the COPD risk group was older and had a higher proportion of males, with statistically significant differences (P < 0.001). In terms of smoking index distribution, a higher proportion of individuals in the COPD risk group had a smoking index ≥ 30 pack-years, with a statistically significant difference (P < 0.001). Regarding mMRC scores, 81.89% of individuals in the non-COPD risk group had an mMRC score of 0, whereas only 5.26% of individuals in the COPD risk group had an mMRC score of 0. The difference was statistically significant (P < 0.001), indicating that a greater proportion of individuals in the COPD risk group experienced dyspnea symptoms.
As depicted in Fig. 2, the typical exhalation sound signals from individuals with varying degrees of obstruction severity are presented. With increasing obstruction severity, a noticeable attenuation in the amplitude of the audio signal is observed, while the effective exhalation time becomes progressively prolonged.

Overall methodological framework
To address the issue of ineffective features, we employed Recursive Feature Elimination (RFE) and XGBoost for feature selection. This approach led to the selection of 20 features for model construction, with their respective importance illustrated in Fig. 3.

Typical exhalation sound signals
Presented in Table 2 are the results of fivefold cross-validation for COPD risk identification using various algorithms, in the absence of cough Mel-Frequency Cepstral Coefficient (MFCC) features. Notably, the performance of XGBoost and Random Forest (RF) was closely matched.
As shown in Table 3, the results of fivefold cross-validation for COPD risk identification using various algorithms are presented, with the inclusion of cough features. Compared to models without cough features, all models, except for Support Vector Machine (SVM), demonstrated varying degrees of performance improvement.
COPD is a preventable and treatable respiratory disease. Conducting COPD risk assessment brings multifaceted benefits. Through risk assessment, COPD can be diagnosed earlier, allowing interventions to begin before the disease progresses to a severe stage. Such early interventions can not only slow down the progression of the disease, improve the quality of life for patients, but also significantly reduce the risk of acute exacerbations. Moreover, early detection and treatment of COPD can significantly reduce medical costs, especially the costs of acute medical events and hospital treatments caused by late-stage disease, benefiting both patients and health insurance organizations.
Currently, portable spirometers available on the market are relatively low-cost and practical tools for conducting COPD risk assessment. However, multiple studies are exploring the development of an alternative to the portable spirometer using smart devices, which only requires the measurement of three core parameters: FVC, PEF, and FEV1. The goal of this approach is to reduce testing costs and enhance its popularity.
Nonetheless, spirometry is a method that requires high patient cooperation, especially when testing is conducted alone at home, obtaining accurate and reliable results is extremely challenging. The simplified alternative using smart devices does not require a mouthpiece, but related factors such as leaks, exhalation distance, and inconsistent cross-section of exhaled airflow can lead to significant errors in flow and velocity. Added to the uncertainty of user cooperation, this further reduces the controllability and accuracy of the test results. Therefore, in this study, we did not conduct research on the detection methods of pulmonary function indicators. Instead, we first defined the risk of COPD as a FEV1/ FVC ratio less than 0.7 and the presence of a history of exposure to risk factors. We then focused on exploring and validating the feasibility and value of using smartphones for COPD risk assessment.
The rationale behind defining COPD risk in this manner in our study is as follows: previous research has shown that among smokers, individuals with an FEV₁/FVC ratio below 0.7 prior to bronchodilation have a significantly higher prevalence of COPD [18]. Some studies have used an FEV₁/FVC ratio below 0.7 prior to bronchodilation for COPD risk screening [19, 20]. Additionally, the GOLD guidelines state that for high-risk individuals, an FEV₁/FVC ratio below 0.7 prior to bronchodilation should raise suspicion for COPD, and further evaluation with a bronchodilator test is recommended [1]. Previous studies have identified advanced age, male sex, tobacco exposure, and symptoms such as dyspnea as high-risk factors for COPD [4, 21,22,23]. Through comparative analysis between the COPD risk group and the non-risk group, this study found that the at-risk group had a higher proportion of older individuals, males, those with higher smoking index (pack-years), and those presenting with dyspnea symptoms. These findings align with existing research and indirectly support the validity of our COPD risk definition.
We specifically recruited volunteers from patients visiting the respiratory department and admitted to the First People’s Hospital of Yunnan Province. These individuals visited the hospital due to some respiratory discomfort, whether or not they had respiratory diseases. The advantage of this approach is that distinguishing COPD risk from other respiratory health issues is more meaningful than conducting a control study with healthy individuals. In the end, we recruited a total of 892 participants for the study. To the best of our knowledge, this is the largest scale study in terms of patient recruitment among all related research. However, due to the loss of questionnaires, gold standard, audio data, and failure to meet quality control requirements, only 530 valid data remained. Among these, 171 cases met the defined COPD risk, while the rest were deemed as non-COPD risk population.
To collect the exhalation and coughing audio data of the subjects, we developed a specialized recording tool. Before data collection, the staff detailed the testing process and methods to the subjects, including how to mimic the blowing action of traditional pulmonary function testing, i.e., blowing hard against the smartphone screen. Importantly, during actual data collection, the staff did not intervene in the subject’s blowing process, ensuring the consistency and effectiveness of the test when the user operates independently. Figure 4 shows typical exhalation audio signals from people with different degrees of obstruction. Normally, audio signals oscillate above and below a baseline of zero, but for easy observation, we calculated the absolute value of the signals. As seen in the figure, due to different degrees of airway obstruction, the amplitude and duration of the audio signals show significant differences. We noticed that for people with no airway obstruction or mild obstruction, their audio signal duration is shorter than those with more prominent obstruction. There are two reasons for this: subjects with mild airway obstruction can usually exhale most of the air explosively at the start of exhalation, so they are unwilling to continue exhaling. The second reason is that the volume of small airflow is often lower than environmental noise, making it undetectable by the microphone.

Typical exhalation sound signals (PS Score = COPD-PS questionnaire score, QS Score = COPD-QS questionnaire score, En1/En6 = energy in first second/ energy in six seconds, MEV = max envelope value, MFCC = Mel-frequency cepstral coefficients)
We chose to use traditional machine learning algorithms for modeling, rather than algorithms based on neural networks. This is because although our valid data reached 530 cases, this is still a small amount for building a powerful COPD risk recognition model based on neural networks. Therefore, in this case, we chose traditional machine learning algorithms that perform better on small-scale datasets. We selected five representative machine learning algorithms based on different implementation principles. For example, XGBoost is representative of gradient boosting algorithms, and Random Forest is representative of ensemble learning algorithms, etc. The principles of different algorithms can effectively overcome specific problems in machine learning tasks, thereby showing unique performance advantages. Ultimately, without using cough characteristics, XGBoost achieved the best performance (precision = 0.88, recall = 0.88). Subsequently, we modeled after summing the mfcc features of cough and exhalation. Except for the Support Vector Machine, the performance of the remaining four models improved to varying degrees. This indicates that cough audio signals carry valid information for COPD risk identification, making a good supplement to exhalation signals. The highest performance result is still XGBoost (precision = 0.90, recall = 0.89, P-value < 0.05).
In the field of smartphone-based pulmonary assessment, various studies have explored different strategies, each with distinct strengths and limitations. SpiroConfidence emphasizes the challenge of maintaining test quality in unsupervised environments, given the susceptibility to ambient noise and user variability [17]. SpiroSmart offers a low-cost solution with a mean error of 5.1% compared to clinical spirometry, focusing on usability within controlled populations [15]. EarSpiro advances the field by using earphones to generate flow-volume curves, addressing the lack of inspiratory data in earlier tools [13]. Separately, the use of voluntary cough sounds has demonstrated the diagnostic value of acoustic biomarkers, though it diverges from traditional spirometric aims. ExhaleSense further contributes by identifying high-quality forced exhalation efforts, prioritizing signal fidelity over functional breadth [10]. Conversely, our study integrates both cough and exhalation audio into a unified machine learning framework, achieving high precision (0.98) and recall (0.89) across a large cohort. This dual-modality approach enhances diagnostic robustness and usability, particularly in low-resource settings, distinguishing our work as a comprehensive and accessible solution for early COPD risk assessment.
In this study, we utilized a smartphone-based system to simultaneously capture cough and exhalation audio signals, applying machine learning algorithms such as XGBoost to screen individuals at high risk for COPD. This contactless, hardware-free approach stands in stark contrast to traditional mobile spirometry methods, which rely heavily on dedicated flow sensors. Early solutions like Mobispiro [14] embedded GSM/GPRS modules into portable spirometers to enable remote data upload, but still depended on physical airflow measurements. More recent systems, such as SpiroSmart and SpiroCall, explored the use of built-in smartphone microphones to record forced exhalation sounds and estimate spirometric indices like FEV₁ and FVC. SpiroSmart required users to perform deep inhalation followed by a rapid exhalation at arm’s length [15], while SpiroCall further reduced hardware demands by transmitting audio via standard phone voice channels to cloud servers [16]. Despite these innovations, such systems fundamentally aim to emulate traditional spirometry, and thus require high user compliance and standardized procedures, which can limit usability in real-world settings. In contrast, our method introduces coughing as a naturally occurring, user-independent respiratory signal, which, when combined with exhalation sounds, allows for a dual-modality framework that enhances the model’s sensitivity to COPD-related pathophysiology while minimizing the need for user compliance.
Compared with previous studies, the present research has demonstrated significant innovation in the field of COPD risk screening. First, we have introduced a novel screening method based on smartphones, which is not only cost-effective and easy to operate but also shifts the screening process from traditional medical settings to everyday life, thereby greatly enhancing the accessibility and scalability of screening. Second, we have made a breakthrough in signal processing by innovatively converting exhaled audio signals into flow information and combining this with cough signal analysis to achieve a comprehensive preliminary screening for COPD risk. Additionally, this study has utilized the largest dataset to date, comprising 530 valid data points, which provides a robust basis for model validation and ensures the reliability of the results. These innovative achievements not only offer new insights for early COPD screening but also pave the way for future mobile-device-based medical applications.
However, there are several limitations to this study. First, the performance of the modeling was not compared with similar studies. The purpose of this study was to explore and verify the feasibility of COPD risk identification based on smartphones, not to develop a method with the highest risk identification performance. Therefore, this study merely built a COPD analysis recognition model based on traditional machine learning methods, without conducting more in-depth research on performance. The performance results achieved by the model should be seen as the baseline performance for this problem. Moreover, different research works define the problem differently and have different datasets, making direct comparison of results impractical. The second limitation of this study is that when using a smartphone microphone to detect forced exhalation, we considered the amplitude of the audio signal as a proxy for exhalation flow. The relationship between sound amplitude and airflow speed is not a simple linear one. As airflow speed increases, the amplitude of the sound also increases, but this increase is not always proportional. For example, at low flow rates, the airflow may produce a lower but relatively constant sound amplitude, while at high flow rates, the increase in sound amplitude may become more significant and complex due to turbulence and other physical factors. Due to the lack of relevant research conditions, we were unable to assess the specific impact of this nonlinear relationship.
Looking forward, with technological advancements and the expansion of datasets, this method is expected to be further optimized and popularized. Research should continue to focus on improving data collection quality, increasing data volume, optimizing algorithms, and exploring more complex audio signal processing techniques. In addition, more clinical trials are needed to validate the effectiveness of these methods and compare them with the results of traditional pulmonary function testing devices. Through these efforts, COPD risk screening technology based on smartphones may become a powerful tool for COPD management worldwide.
In this study, we explored a novel approach for COPD risk screening using smartphones. This method is based on the analysis of cough and forced exhalation sound signals, employing machine learning algorithms to identify COPD risk. We collected a valid dataset of 530 instances and utilized the XGBoost, SVM et al. algorithm along with fivefold cross-validation for model construction and evaluation, achieving a precision of 0.90 and recall of 0.89. Our results suggest that this approach is feasible for practical application. Its value lies in offering a low-cost, convenient method for COPD risk screening, particularly suitable for resource-limited settings. This smartphone-based method enables patients to perform lung function tests at home, potentially facilitating early detection and treatment of COPD. Consequently, it may alleviate disease severity, improve quality of life, and reduce healthcare costs.
This study employed a cross-sectional design and adhered to the STROBE (Strengthening the Reporting of Observational Studies in Epidemiology) guidelines [24]. This study was conducted in the Department of Pulmonary and Critical Care Medicine at the First People’s Hospital of Yunnan Province, enrolling a total of 892 participants from December 2023 to March 2024. The study received approval from the Ethics Committee of the First People’s Hospital of Yunnan Province (KHLL2023-KY105). All participants in the study have provided their written informed consents. Individuals who were 18 years of age or older and capable of completing pulmonary function tests were included. Individuals were excluded from the study if they: (1) were unable to complete the pulmonary function test; (2) had contraindications to pulmonary function testing; (3) had a recent history of thoracic surgery; (4) were pregnant or lactating women.
The sample size calculation was initially performed using the sample size formula for simple random sampling, expressed as:
$$\text{N}=\frac{{{(Z}_{\alpha /2})}^{2}pq}{{\delta }^{2}}.$$
(Notes: N = the minimum sample size; \({Z}_{\alpha /2}\)= the standard normal deviate corresponding to a level of significance of 0.05 is 1.96; \(p\) = the prevalence of COPD high-risk individuals was reported as 18.99% in previous study [25]; q = 1- \(p\); \(\delta\)= the desired precision 0.05.)
Therefore, the calculated minimum sample size was 236 participants. Furthermore, considering a design effect of 2 for the cluster sampling approach, the required sample size was at least 472 subjects. This study ultimately enrolled 892 participants, meeting all methodological requirements.
The participant data collection workflow is illustrated in Fig. 1. First, we collected baseline data from participants, including age, sex, and exposure history. Concurrently, dyspnea symptoms were assessed using the modified Medical Research Council (mMRC) scale. Subsequently, each participant was asked to complete two questionnaires, COPD-SQ [26] and COPD-PS [27]. Next, we developed a recording application to collect audio data, as shown in Fig. 4. This application was installed on an Oppo FindX5 smartphone. The application utilized the phone’s microphone to capture audio signals at a sampling rate of 32 kHz. The data collection process was as follows:
Upon completion of the audio data collection, the participants were guided to the pulmonary function room for a standard pulmonary function test by the professional and certified technicians using the MasterScreen PFT (Jaeger), in strict accordance with the guidelines of the American Thoracic Society (ATS) and the European Respiratory Society (ERS) [28]. The risk of COPD was defined as the presence of both an FEV₁/FVC ratio below 0.7 and a documented history of exposure to known risk factors, such as smoking and biomass fuel exposure.
As shown in Fig. 2, initially, audio data of exhalation and coughing are collected using the smartphone microphone, following a predetermined collection pattern. Subsequently, the audio signals are segmented to obtain optimal signal fragments. Based on these exhalation signal fragments, the root mean square (RMS) envelope is calculated to obtain statistical features. This involves computing the square root of the average of the squares of the audio signal amplitude over each fragment. Concurrently, the Mel spectrum of both exhalation and cough signals is computed using a fast Fourier transform (FFT) to obtain Mel frequency cepstral coefficients (MFCC). These, combined with demographic information and scores from two survey questionnaires (COPD-PS, COPD-SQ), constitute the feature set. A feature subset is constructed through feature selection methods, and classifiers such as Extreme Gradient Boosting (XGBoost), Support Vector Machine (SVM), K-Nearest Neighbors (KNN), Bayes (NB), and Random Forest (RF) are employed for the classification of COPD risk.
Upon completion of data collection, the initial task was signal segmentation and data quality assessment to eliminate samples with poor data quality. Segment segmentation was determined using a fixed threshold method to identify the starting points of the exhalation or cough signals. From the starting point, a 6-s audio signal was extracted as the exhalation segment, and a 2-s signal was extracted for the cough segment. To ensure accuracy, manual quality control was conducted based on the following criteria:
In this study, the barlow of the exhalation audio signal was considered a reasonable approximation of the exhalation flow rate. The root mean square value was used to extract the envelope for each exhalation segment. Based on the calculated envelope, three statistical features were extracted: the envelope energy within the first second, the total envelope energy, and the peak envelope value. For each exhalation and cough audio signal, 40 Mel-frequency cepstral coefficients (MFCCs) MFCC1-40 were computed using the Librosa library (Frame length: 100ms, Overlap: 50%). The features utilized in this study are presented in Table 4. To ensure the reliability of the credibility analysis results, we did not employ data augmentation techniques, so as to avoid generating unrealistic features.
The Recursive Feature Elimination (RFE) is a powerful feature selection method that identifies the most useful features by recursively reducing the size of the feature set under consideration. This method is particularly suitable for scenarios where feature selection is needed to enhance model performance or interpretability. Initially, RFE requires a base predictive model. In this study, XGBoost was chosen as this base predictive model. After the first round of training on the entire feature set, the importance of the features was calculated, and the least important features were eliminated. Upon removal of these features, the model was retrained on the reduced feature set. This process was repeated, with each iteration eliminating a batch of the least important features and retraining the model until the number of features was reduced to 20.
The fundamental idea behind XGBoost is to combine multiple weak learners (typically decision trees) and iteratively correct the errors of the previous step to a certain extent, thereby creating a strong learner. Specifically, XGBoost employs a gradient boosting framework where each iteration adds a new tree that attempts to correct the prediction errors of all preceding trees. In practical applications, XGBoost has proven to be an excellent tool in various medical disease classification problems, thanks to its superior modeling performance and interpretability, making it one of the preferred algorithms for medical researchers [29].
SVM, or Support Vector Machine, is a supervised learning algorithm. Its core concept is to find an optimal hyperplane (a boundary line in high-dimensional space) to separate data of different categories. By maximizing the margin between classes (i.e., the distance between the decision boundary and the nearest sample points), SVM can enhance the model’s generalization ability. For nonlinear data, SVM uses kernel functions to map the data to a higher-dimensional space, making the data linearly separable in this high-dimensional space. SVM excels in disease identification, especially when the data dimensions are high and the boundaries between classes are clear. It can handle complex nonlinear relationships through kernel tricks without explicitly calculating high-dimensional mappings. This gives SVM a significant advantage in dealing with complex features and data relationships, particularly for small-scale medical datasets, where its robustness and generalization capabilities are prominent [30].
Random Forest is an ensemble learning method that constructs multiple decision trees and makes the final classification or regression decision based on the predictions of each tree. Each tree uses a random subset of the training data during training, and features are randomly selected at each split, effectively preventing overfitting. The decision of the Random Forest is obtained through a voting mechanism, hence it has good noise resistance and stability [31].
KNN, or K-Nearest Neighbors, is an instance-based learning method. Its core idea is that for each test sample, it finds the K nearest samples in the training set and classifies the test sample based on the majority class label of these K samples. KNN does not rely on any assumptions or parameters but classifies based on the similarity between data, making it a simple and effective non-parametric method. KNN is suitable for small-scale datasets, especially when the data feature space is clear. For some specific disease classification problems, the distances between features can well reflect the differences between classes, enabling KNN to achieve good results without many complex model assumptions [32].
The Naive Bayes classifier is a probabilistic model based on Bayes’ theorem, which assumes that features are conditionally independent of each other. Given a set of features for a sample, the model calculates the posterior probability for each class and assigns the sample to the class with the highest posterior probability. Despite the simplicity of the “independence assumption” in the Naive Bayes model, it performs well in many classification tasks in practice, especially in text classification and medical diagnosis. Because of its high computational efficiency, strong adaptability to small datasets, and clear interpretation of the probability distribution between classes, the Bayes classifier is often used for disease identification in the medical field. The Bayes classifier can handle missing data and class imbalance problems, which are especially important in actual disease diagnosis. Furthermore, it is suitable for probability-based explanations, which are very helpful in explaining the decision-making process of models in medical diagnostic problems [33].
The collected data were processed using the aforementioned algorithms, and the precision and recall of COPD risk were analyzed and compared across different algorithms in order to identify the one with the optimal precision and recall.
In this study, we employ a fivefold cross-validation for optimal parameter search and result evaluation. Precision and recall are used as performance metrics, which help us understand the model’s performance in predicting diseases, particularly in imbalanced datasets (for instance, where positive disease samples are much less than negative ones).
Precision is a measure of the proportion of true positives (i.e., diseased) in the model’s predicted positive results. In other words, it indicates how many of the samples that the model predicts as “positive” are actually positive.
$$Precision = \frac{True positive}{True positive +false positive},$$
where true positive (TP): the number of instances that the model correctly predicts as positive (diseased). False positive (FP): the number of instances that the model incorrectly predicts as positive but are actually negative (not diseased).
Recall is a measure of the proportion of actual positive samples that the model correctly predicts as positive. That is, among all the people who are truly diseased, how many are successfully detected by the model.
$$Recall = \frac{True positive}{True positive +false negative},$$
where true positives (TP): the number of instances that the model correctly predicts as positive. False negatives (FN): the number of instances that the model incorrectly predicts as negative (i.e., not diseased), but are in fact positive.
The data were organized, statistically analyzed, and interpreted using SPSS27.0 (Statistical Product and Service Solutions 26.0) statistical analysis software. Participants with missing data were excluded from the final analysis. Count data were described using n (%), and the normality of measurement data was analyzed using the S-W normality test. Normal distribution measurement data were described using the mean and standard deviation (mean ± SD), while non-normal distribution measurement data were described using the median and interquartile range [M (interquartile range, IQR)]. Differences in rates between groups were compared using the Chi-square test. The differences in normal indicators between two groups were compared using the independent samples t-test. The differences in non-normal indicators between two groups were compared using the Mann–Whitney U test. A P-value less than 0.05 indicates statistical significance.
Data are available on reasonable request.
We thank the participants of the study. We also thank the staff who contributed to collect audio data in this study (Jingze Liu and Haoran Han).
This study was funded by supported by OPPO Research Fund. An Investigator-Initiated Clinical Research Project at the First People’s Hospital of Yunnan Province (LCYJ2023016).
The study was initiated and led by the First People’s Hospital of Yunnan Province and was approved by the Ethics Committee of the First People’s Hospital of Yunnan Province (KHLL2023-KY105). Written informed consent has been obtained from all study participants.
The authors declare no competing interests.
Springer Nature remains neutral with regard to jurisdictional claims in published maps and institutional affiliations.
Open Access This article is licensed under a Creative Commons Attribution-NonCommercial-NoDerivatives 4.0 International License, which permits any non-commercial use, sharing, distribution and reproduction in any medium or format, as long as you give appropriate credit to the original author(s) and the source, provide a link to the Creative Commons licence, and indicate if you modified the licensed material. You do not have permission under this licence to share adapted material derived from this article or parts of it. The images or other third party material in this article are included in the article’s Creative Commons licence, unless indicated otherwise in a credit line to the material. If material is not included in the article’s Creative Commons licence and your intended use is not permitted by statutory regulation or exceeds the permitted use, you will need to obtain permission directly from the copyright holder. To view a copy of this licence, visit http://creativecommons.org/licenses/by-nc-nd/4.0/.

Wen, G., Wang, C., Zhao, W. et al. Assessing chronic obstructive pulmonary disease risk based on exhalation and cough sounds. BioMed Eng OnLine 24, 82 (2025). https://doi.org/10.1186/s12938-025-01420-6
Received:
Accepted:
Published:
DOI: https://doi.org/10.1186/s12938-025-01420-6