Environmental Sciences Europe volume 37, Article number: 90 (2025) Cite this article
Cement industries contribute significantly to poor air quality globally. As cement production expands in Nigeria, so too does its environmental footprint. Despite the well-documented dangers of cement-related air pollution, there is a lack of comprehensive scientific evidence-based studies on monthly variations of air quality around cement plants in Southern Nigeria. There is a pertinent need for a systematic investigation into how cement production affects dry atmospheric chemistry and contributes to environmental degradation in the region; hence, the study evaluated the effect of cement production processes on ambient atmospheric chemistry at the Lafarge Holcim cement processing plant in Cross River, Southern Nigeria. Using mobile real-time air quality monitors (MX IBRID) , levels of carbon monoxide (CO), carbon dioxide (CO2), sulphur dioxide (SO2), nitrogen dioxide (NO2), volatile organic compound (VOC), hydrogen sulphide (H2S) and particulate matter (PM2.5, PM10) were taken from cement production sites: milling site, quarrying site and loading bay for a 12-month period (January to December, 2023). The results revealed that the milling site had the highest relative levels of dry atmospheric chemistry (NO2; 0.15 ± 0.01 ppm, SO2; 5.78 ± 0.008 ppm, VOCs; 8.41 ± 0.13 ppm, CO; 575.5 ± 722.5 ppm, PM10; 346.2 ± 128.4 μg/m3), and the quarrying site had the highest PM2.5 (31.6 ± 0.04 μg/m3). Comparison with different global standards showed significant exceedances in CO, SO2 and NO2, PM10 across the three sites with more than 35% increase relatively. The correlation matrix revealed a significant relationship among and between pollutants and meteorological parameters. Principal component analysis showed high positive and negative loadings of CO, CO2, SO2, NO2, VOC, H2S, PM2.5 and PM10 existing in clusters from different sources. The monthly air quality index report implicated PM10 and SO2 as major constituents of hazardous and very unhealthy air quality around the area. Key recommendations were made, among others, that the company must regularly conduct an environmental audit of all their processes so as to improve their environmental performance, adopt pollution reduction technologies such as the use of water spray, gas scrubbers, filters and alternative sources of fuel such as solar power. Environmental regulators must also brace up and issue sanctions, set restrictions and issue heavy fines when there is a breach of environmental responsibilities on the part of the company.
As cities expand and populations grow, especially in developing regions, the demand for housing continues to rise. This has, in turn, led to an increase in cement production, as cement remains a key material for building infrastructure. In Nigeria, this growing demand has resulted in the rapid production activities of cement production plants across the country [1,2,3,4].
Globally, an estimated production of about 2.18 billion tonnes of cement and 4.3 billion tonnes of cement were reported in 2012 and 2014, respectively [3]. In Africa, the increased rise in the market value of building materials as well as the rising importation of cement products have sped up the development of cement factories [5]. In Nigeria, an estimated increase in cement production from 28 million tonnes in 2013 to 30.75 million tonnes at present has been duly reported [6]. While this growth signals economic progress, it also raises critical environmental concerns.
Cement production plants have been known to contribute to environmental pollution [7], affecting air quality, water sources, soil health and vegetation [8], by releasing various harmful pollutants and causing potential harm to humans, flora and fauna in the makeup of the environment. Cement production is among the top 17 most polluting industries globally, as listed by the Central Pollution Control Board [9]. Cement production industries are potentially inimical to the air quality of the environment. They are high-ranking anthropogenic air pollution source, with large chunk of their contribution to dust, oxides of nitrogen (NOx), sulphur (SOx) and carbon monoxide (CO) [10]. It is, in fact, one of the most significant contributors to climate change, emitting more than 5% of global CO2, a major driver of climate change [11]. Despite these alarming statistics, there is still a gap in understanding how cement production impacts air quality, particularly in South-South region of Nigeria, where industrialization is expanding, and so may have a unique environmental and climatic condition.
The process stages in cement production, viz., quarrying, milling, raw material transport, kiln operation, clinker cooling and stockpiling, all contribute significantly to dust emission [12]. Again, the transportation of raw materials, finished products and power generation contributes to the reduction of air quality and build-up of carbon monoxide, nitrogen dioxide and sulphur dioxide in the atmosphere. This could arise as a result of incomplete fuel combustion and by-products [11, 13, 14], as well as the oxidation of volatile sulphur usually present in the type of limestone harnessed as raw material use [15]. Thus, oxides of sulphur, nitrogen, carbon and particulate matter constitute the prime air pollutants associated with cement production industries.
More troubling is the fact that these emissions contribute to climate change and respiratory diseases. For instance, sulphur emissions in cement production plants may arise from fuel combustion and oxidation of cement raw materials containing Sulphur during the extraction processes [16, 17]. Once released, these compounds undergo complex atmospheric reactions, forming sulfuric acid and sulphate particulates, which contribute to acid rain and environmental acidification. When sulphur is emitted, it pairs with surrounding oxygen to produce SO2, which is further converted to sulphuric acid (H2SO4) through several processes and then to sulphate particulate such as ammonium hydrogen sulphate (NH4HSO4) [18,19,20], as expressed below:
$${\text{S}}\left( {\text{g}} \right) + {\text{O}}_{{2{ }\left( {\text{q}} \right)}} \to {\text{SO}}_{{2\left( {\text{g}} \right)}}$$
(1)
$$2{\text{S}}\left( {\text{g}} \right) + 12{\text{O}}_{{2{ }\left( {\text{q}} \right)}} \to {\text{H}}_{2} {\text{O}}_{{\text{g}}} \to { }2{\text{H}}_{2} {\text{SO}}_{4} \left( {{\text{aq}}} \right)$$
(2)
$${\text{NH}}_{3} \left( {\text{a}} \right) + {\text{ H}}_{2} {\text{SO}}_{{4{ }\left( {{\text{aq}}} \right)}} \to {\text{H}}_{2} {\text{O}}_{{\text{g}}} \to { }4{\text{O}}_{4} {\text{HSO}}_{{4{ }\left( {{\text{aq}}} \right)}}$$
(3)
According to [21, 22], SO2, as shown in Eq. (2), is a prime contributor to acid rain, which is known for its deleterious effect on flora and fauna. Likewise, nitrogen oxides (NOx), produced through high-temperature fossil fuel combustion in rotary kilns, lead to the formation of tropospheric ozone and nitric acid, both of which exacerbate global warming and air pollution [23], and it finds its way into the atmosphere via the exit of gases as it passes through several chemical reaction stages in the layers of the atmosphere [24]. In one of the major reactions, nitrogen (N2) combines with oxygen (O2) at high temperature in the tropospheric layer of the atmosphere to form NO. The produced NO, due to being highly unstable, will be transformed to NO2 after being photolyzed in the presence of sunlight, as shown in the equations below [25, 26]. The oxygen atom formed may combine with molecules of oxygen to form tropospheric ozone, which is a menace and contributes to global warming.
$${\text{N}}_{2} + {\text{O}} \to {\text{NO}} + {\text{N}}$$
(4)
$${\text{N}} + {\text{O}}_{2} \to {\text{NO}} + {\text{O}}$$
(5)
$${\text{NO}} + {\text{OH}} \to {\text{NO}}_{2}$$
(6)
The formed NO2 reacts with hydroxyl (OH) to form nitric acids [27]:
$${\text{NO}}_{2} + 2{\text{O}}_{2} + {\text{NO}}_{2}$$
(7)
Both SO2 and NOx are majorly emitted at the kiln.
Furthermore, oxides of carbon (COx) in cement production essentially arise during thermal decomposition of carbonates or decarbonization and fossil fuel combustion in the kiln, which collectively constitute the chief global contributor of atmospheric carbon dioxide (CO2) [28]. During calcination, limestone is broken down, and CO2 is produced in the process. The combustion of fossil fuel for either electricity generation or material processing in the kiln emits carbon dioxide in high amounts. Usually, such waste materials as tyres with high amounts of carbon are frequently used in cement kilns so as to make use of their energy content [29]. Thus, while the processing of raw materials for cement production, or rather called “decarbonization,” generates one half of the total carbon dioxide emitted, fuel combustion generates the other half. In addition, carbon monoxide (CO) is usually formed from the incomplete combustion of fuel or any carbon-based material [30]. Therefore, whenever any carbon-based material combusts, CO arises from the process as there is usually no sufficient air mixing with fuel to ensure a complete combustion process [31]. Like ozone, CO2 is also a leading cause of climate change. CO competes with haemoglobin in human blood cells, which could eventually lead to death.
Several research reports have implicated cement production as being the major source of particulate matter pollution in the environment, accounting for 20–30% of PM pollution, which is 40% of the total industrial emission [32]. Particulate matters (PM10, PM2.5), which are fine particles such as soot, dust and liquid droplets able to suspend in air and can constitute a health hazard to man, also arise from the cement production process [33, 34]. PM emissions mainly occur at the quarry, grinding and crushing site of raw materials such as limestone and clinker and is emitted at higher levels than other pollutants [35]. At the cement quarry site, rock materials and quarry resources are harnessed from below or on top of the land surface [36]. This process can generate particulate matter (dust) with a diameter of 1–75 µm (micron) [37]. Particulate matter that has aerodynamic diameters less than 50 µm, known as Total Suspended Particulate Matter (TSP), can effortlessly suspend in the atmosphere, and those with aerodynamic diameters equal to or less than 10 µm, known as the inhalable fraction (PM10), and those with aerodynamic diameters equal to or less than 2.5, known as the respirable fraction (PM2.5), can be transported over long distances [38] and find their way to the human respiratory system [39, 40]. Particulate matter is generated during transport, storage, milling, packing, etc. [35], and they have a serious impact on plants, animals and humans [41, 42]. PM dust and other air pollutants like NO2 can cause irritation and respiratory tract diseases such as asthma, chronic bronchitis and silicosis, as well as skin allergies or dermatitis.
The problem is clear: as cement production expands in Nigeria, so too does its environmental footprint. However, despite the well-documented dangers of cement-related air pollution, there is a lack of comprehensive scientific evidence-based studies on monthly variations of air quality around cement plants in South-South Nigeria. Thus, there is a pertinent need for a systematic investigation into how cement production affects dry atmospheric chemistry and contributes to environmental degradation in the region, as well as the extent of air pollution in the region and its potential impact on climate and public health. This study therefore aims to bridge this gap in literature by attempting to identify and quantify the major air pollutants (SO2, NOx, CO2, CO, PM) emitted from cement production processes and examine the chemical transformations of these pollutants in the atmosphere as well as meteorological influence, which is crucial for understanding long-term climate effects. The study also analysed the seasonal and monthly variations in air quality around the study area, thereby adding a temporal dimension to pollution monitoring in this region, their effect on the environment, and potential health effects. In addition, the study also tried to provide scientific recommendations for pollution control and sustainable industrial practices in cement manufacturing.
The study location is at Akamkpa Local Government Area (Fig. 1) which is situated between (latitudes 5° 00ʹ and 5° 57ʹ N; longitudes 8° 06 and 9° 0 E), located in the southern part of Cross River State, Nigeria.

Map of Lafarge Holcim Mfamosing Akamkpa Cross River State, Nigeria. Source: [43]
After a pre-test survey of the study area (Fig. 1) in December 2022, three sampling sites were identified based on the consideration of the involved stages of the cement production process at the Lafarge Holcim cement processing plant, Cross River State, Nigeria. The three sampling sites include the quarrying site, the milling site and the loading bay. The quarrying site is farther from the cement plant and is a place where the parent raw materials for cement production are sourced by drilling, mining and blasting. These materials include a conglomerate of sand, blasted rock and stones comprising mainly of limestone, marble, sandstone and slate. These materials are mined, overburdens are removed, and subjected to cutting and polishing with the use of heavy equipment like the excavators and payloader at the quarrying site. After cutting and polishing, the materials are then hauled and transported to the milling site. At the milling site, the polished and cut proportions of the raw materials are homogeneously ground and regrind in a grinding mill to make the particles finer in size. Drying, grinding and mixing are done concomitantly as hot gas from the clinker burning chamber is allowed passage into the grinding fan to assist the process after passing through several other treatments to a finished product. The finished product is then sent to the loading and packaging bay, where cement extracted from the storage silos is packed in sacks and bags. The loading bay applies several other technologies and heavy machines that run on electricity and gasoline for packaging.
The pollutants sampled include CO, CO2, SO2, NO2, VOC, H2S, PM2.5 and PM10 at ground level (between 1.2 and 1.65 m above the ground) at each of the cement quarrying site, milling site and loading bay. The ground level height is regarded as the breathing zone (the immediate area surrounding a worker’s nose and mouth where the majority of air is drawn into their lungs and also regarded as the range of average human height, whether adult or children) of humans, whether standing or sitting [44]. The reason for the selection of these pollutants is that they are considered majorly constituting criteria air pollutants for air quality assessment according to the US Environmental Protection Agency and are directly associated with cement production emissions [8, 10, 45, 46], which may be inimical to health when in excess.
Sampling was done using a sensitive multi-gas monitor, the IBRID MX6 model (manufactured by Industrial Scientific), for measurement of the parameters of air quality monitored at the selected sites. The parameters measured are CO, CO2, SO2, NO2, VOC and H2S, while the MET ONE model GT521 particulate counter (manufactured by Met One Instrument, Inc.) was used to measure PM10 and PM2.5 and relative humidity. Extech thermo-anemometer for measurement of temperature, wind speed, vibration and noise; handheld portable GPS for geo-point sampling. The instruments were ensured to be calibrated by the manufacturers/hiring company using the company’s established standard procedures for quality assurance before deployment into the field.
Sampling was done monthly throughout the year (January–December, 2023). Each of the sites (quarrying, milling and loading) was sampled at different weeks of the month for three times in a week (Monday to Wednesday) for an hour of average time. This sampling frequency was based on the visible ongoing cement production process or activities at each of the sites and were the designated days for production activities according to information provided by the staff. For each month, the researchers sampled each site. Meteorological parameters such as wind speed, relative humidity and temperature were also measured concomitantly for each phase of the measurements of the gas sample to get an average reading for each of the meteorological parameters. Sampling was done by lowering the gas monitor to a height of between 6ʺ and 9ʺ above the ground level to take the concentration of the pollutants from the source within the sites.
Data generated from the field were subjected to analysis of variance (ANOVA) with the Statistical Package for the Social Sciences (SPSS version 20) software. Data were computed in mean concentration of parameters of interest and standard deviation and presented in Table 2, showing significant variations among locations at the p < 0.05 significance level. Pearson’s product moment correlation was also used to show the linear relationship existing among and between pollutants and meteorological parameters as well as their implications for the study. This was represented in a correlation matrix. Principal component analysis (PCA) and component analysis (CA) were used to estimate the individual quantitative and qualitative contributions of pollutants of interest. PCA with varimax rotations was adopted for the dataset matrix to establish the possible individual pollutant contribution. CA was used to analyse the characteristics of air pollutants based on the similarities of the pollutants and their relationship among air quality parameters.
The EPA National Ambient Air Quality Standard (NAAQS), World Health Organization (WHO), Federal Ministry of Environment (FMEnv) and the Nigerian National Ambient Air Quality Standard (NNAAQS) [47,48,49,50] were used as a baseline or control for the study since it was difficult for the researchers to come across a model serene environment that could serve as a control for comparison in such an industrial city. The mean concentrations of the parameters generated on the field for all the locations were used to provide information on the compliance level of air quality in the study area.
Daily Air Quality Index (AQI) was calculated and used to describe the air quality status of the study locations. The average concentrations of the measured parameters, breakpoints of pollutants for AQI (Table 1) and the interpolation equation as shown below were used in computing the AQI:
$$\frac{{{\text{IH}}_{I} - {\text{ILo}}}}{{Bp_{{{\text{HI}}}} - {\text{BP}}_{{{\text{Lo}}}} }} \left( {{\text{Cp}} - {\text{Bp}}_{{{\text{Lo}}}} } \right) + {\text{ILo}}$$
(8)
where Ip is the index of pollutant, P; Cp is the rounded concentration of pollutant P; BPHI is the breakpoint that is greater than or equal to CP (upper limit); BPLO is the breakpoint that is less than or equal to CP (lower limit); IHI is the AQI value corresponding to BPLO.
During January–December at the quarry site (Table 2, Fig. 2), NO2 ranged from 0.03 ± 0.00 to 0.123 ± 0.01 ppm, with the months MJ having the lowest value (0.03) and JF having the highest value (0.123), with no significant difference throughout the year at the p ≥ 0.05 level. Sulphur dioxide (SO2) ranged from 0.21 ± 0.01 to 0.85 ± 0.01, with MA having the lowest value (0.21) and ND recording the highest (0.85) at no significant variation across the months (p ≥ 0.05). VOC ranged from 0.425 to 39.71 ppm, with JF having the lowest value (0.425) and ND with the highest value (39.71) with a mean value of 7.3 ± 0.01 ppm. ND and JA are significant from other months at p < 0.05.

Temporal variations of air quality at rock quarrying site in the study area
CO2 varied from 425.50 ± 0.71 to 612.50 ± 0.71 ppm, with the mean value of 490.5 ± 0.71 ppm, and apart from MA and ND showing variation at the p < 0.05 level of significance, other months are significantly the same at the p > 0.05 level. The lowest CO2 was recorded in JA, and the highest was in MA (Table 1, Fig. 2). CO ranged from 61.58 ± 0.02 to 63.55 ± 0.01 ppm, with a mean value of 62.4 ± 0.13 ppm, and aside from JF and MJ, which are statistically the same, other months are significantly different at p < 0.05. PM2.5 (μg/m3) ranged between 0.200 ± 0.00 and 34.71 ± 0.01, with a mean value of 31.6 ± 0.04, and MA having the lowest value and statistically different from other months at p < 0.05, while MJ peaked highest. PM10 (μg/m3) ranged from 280.85 ± 0.71 to 441.15 ± 0.07, with a mean value of 306.2 ± 0.60, and the month of November–December (ND lower in concentration than Jan-Feb (JF), varying statistically at p > 0.05). H2S (ppm) ranged from 0.02 to 0.01 to 0.04 to 0.02 ppm, with a mean value of 0.03 ± 0.01 ppm, and no statistical difference throughout the year at the p < 0.05 level. The mean value of atmospheric chemistry in the quarrying site was in a decreasing abundance trend of CO2≥ PM10≥ CO ≥ PM2.5 ≥ VOC ≥ SO2 ≥ NO2 ≥ H2S. The result is in tandem with the finding of [45], who reported that the emission of SO2 and NO2 is negligible in the vicinity of quarry site [46].
Over the months of the year at the milling site (Table 2, Fig. 3), NO2 ranged from 0.05 \(\pm\) 0.01 to 0.41 \(\pm\) 0.01 ppm, with MJ having the lowest concentration, while ND recorded the highest value, with a mean value of 0.15 ± 0.01 ppm with no statistical difference at (p < 0.05) throughout the year; SO2 ranged from \(0.32\pm\) 0.01 to 0.87 \(\pm\) 0.01 ppm, with MA having the lowest value and ND with the highest value and a mean value of 5.78 ± 0.008 ppm, with no statistical difference at (p < 0.05) throughout the year. VOC ranged from 0.515 \(\pm\) 0.01 to 45.50 \(\pm\) 0.71 ppm, with JF having the lowest value and the highest value in ND, with a mean value of 8.41 ± 0.13 ppm. CO2 ranged between 436.50 \(\pm\) 0.71 and 683.00 \(\pm 1.41\) ppm, with MA having less value and JA having the highest value, with 575.00 \(\pm\) 69.29 ppm as the mean and JF and ND being statistically different from other months at p < 0.05. CO ranged between 62.05 \(\pm\) 0.04 and 3125.99 \(\pm\) 4333.17 ppm, with MJ having the lowest value and SO recording the highest with the mean of 72.23 \(\pm\) 0.01 ppm. PM2.5 ranged from \(19.001\pm 0.00\) to 46.25 \(\pm\) 0.07, with MA having lowest value and ND having the highest, with the mean value of 28.3 ± 0.03 ppm, PM10 ranged from 120.01 \(\pm\) 0.01 to 472.65 \(\pm\) \(2.18\), with JA recording the least value, while JF had the highest value with a mean of 346.2 ± 128.4 ppm; H2S ranged from 0.00 \(1\pm\) 0.00 to \(0.04\pm 0.01\), with a mean value of 0.01 ± 0.005, with JA > JF. Ultimately, the dry atmospheric chemistry indicators were in decreasing trend: CO ≥ CO2 ≥ PM10 ≥ PM2.5 ≥ VOC2 ≥ SO2 ≥ NO2 ≥ H2S.

Temporal variation of air quality at cement milling site in the study area
At the loading site (Table 2), NO2 (ppm) ranged from 0.05 to 0.38 ppm, with MJ having the lowest value and ND recording the highest value, and the months were statistically the same at the p > 0.05 level of significance.
SO2 ranged between 0.29 ± 0.01 and 0.51 ± 0.01 ppm, with MA recording the lowest concentration and JF and JA having the highest value, respectively, with a mean value of 0.14 ± 0.01, and the months of JF and JA were statistically different at p < 0.05. VOC ranged from 0.49 to 0.01 to 42.50 to 0.71 ppm, with JF having the lowest value and ND recording the highest concentration, with a mean value of 0.47 ± 0.01 ppm, and the months of MJ and JA were statistically different at p < 0.05. CO2 ranged from 43.56 ± 0.08 to 66.61 ± 0.01 ppm, with JA recording the lowest value and JF with the highest value with a mean value of 56.9 ± 0.19 ppm, with JF and MJ being statistically different from other months at p > 0.05. CO varied from 1.54 to 0.0–3.75 to 0.35 ppm, with JF being the lowest concentration and MA having the highest with a mean value of 2.41 ± 0.17 ppm, and JA being statistically different at p < 0.05. PM2.5 ranged from 0.01 to 45.36 to 0.08 µ/gm3, with JA having the least value and ND with the highest concentration, recording the mean value of 27.03 ± 0.03 µ/gm3. JF and SO were statistically different from the other months that were statistically the same at p > 0.05. PM 10 ranged between 315.01 ± 0.01 and 461.00 ± 1.41 µ/gm3, JA ≤ JF in concentration, having the mean value of 336.7 ± 0.71 µ/gm3, with JA and SO being statistically the same and different from others at p < 0.05. Accordingly, H2S ranged from 0.00 to 0.02 to 0.01 ppm, with JA and SO having no value and JF with the highest concentration, and a mean of 8.3 ± 0.003 ppm, and the months were statistically the same at p > 0.05. During the loading of the raw materials, the dry atmospheric chemistry indicators were in a decreasing trend: PM10 ≥ CO2 ≥ PM2.5 ≥ H2S ≥ VOC ≥ CO ≥ SO2 ≥ NO2, respectively. This result is in tandem with the report that PM10 particles peak high in cement processing locations and are able to penetrate deep into the human lungs [53, 54]. The present findings agree with previous reports on the high level of air pollution from particulate matter ranging from 16.8 to 31.5% in Spassk–Dalny and 34.8% to 65% relative to other fractions in the Spassk cement plant in Primorsky Krai, Russia [54, 55].
The total mean ± SD of the dynamics of NO2 ranged between 0.071 ± 0.002 and 0.15 ± 0.01 ppm (Table 3), with rock quarrying recording the lowest concentration while rock milling recorded the highest values, and site concentration in decreasing order of rock milling ≥ rock loading ≥ rock quarrying (Table 3). The values of NO2 in this study are ≤ 0.1–1.7 ppm of NO2 from cement production in Ogun State, Nigeria [56], and ≤ 0.09 ppm in the cement mill in Ewekoro [57]. The result of NO2 of the study at the three locations was all above the 0.02 ppm (WHO) and 0.04–0.06 ppm (FMEnv/NAAQS) permissible limit for clean air. High concentrations of oxides of nitrogen (NOₓ) can trigger respiratory ailments and lung diseases as well as susceptibility to respiratory infection [20]. This NOx is capable of causing high levels of tropospheric ozone, suspended particles and methane, which is a greenhouse gas [58]. Nitrogen dioxide (NO2) has been reported to lead to eye mucosa, nose irritations, throat and respiratory system [59, 60]. It has been reported that exposures at 2.0–5.0 ppm affect lymphocytes, especially CD8+ cells and natural killer cells that function to provide host defences against viruses [61]. Accordingly, it is reported that the concentration of NO2 between 0.2 and 0.6 ppm is harmless for the human population [62]. This disagreed with permissible limits for NO2 by WHO (0.02 ppm), FMENV (0.03 ppm) and NAAQS (0.05 ppm) for clean air, respectively.
SO2 ranged from 0.42 ± 0.01 to 5.78 ± 0.008 ppm, with the quarrying site recording the least and milling being the highest value ≥ sulphur dioxide (0.1–12 ppm) due to cement production [57], an average value of 115.82 μg/m3 at the cement factory [33] and > 0.02–0.08 ppm in old Netim [64]. The mean (SO2) is greater than 0.08 ppm (WHO), 0.01 (FMEnv) and 0.1 (NAAQS) for clean air. The result disagreed with the finding of [10], who reported that SO2, NO2 and CO were well below the permissible limit for ambient air quality by the cement industry. The negative effects of SO2 on humans include respiratory issues [65,66,67]. Long-term exposure to SO2 leads to temporary loss of smell, dizziness, irritation of lungs, headache, phlegm, coughing, shortness of breath, nausea, bronchitis and reduced fertility both in males and females [68]. Sulphur dioxide is the most corrosive agent in the atmosphere, aided by water vapour to produce sulfuric acid in the presence of sunlight, which can be precipitated as acid rain [69], impacting ecosystems [70]. Human sensory organs such as eyes and nasal cavities can become irritated when exposed to SO2 by inhalation due to its acid anhydride property [70]. Respiratory diseases, allergies and cardiovascular inflammation have also been linked to exposure to SO2 [71].
VOC ranged from 7.3 ± 0.01 to 8.41 ± 0.13 ppm, with quarrying having the least value, while milling recorded the highest value, greater than zero (0) ppm obtained from cement production in Ogun State [56], and greater than VOC values of 0.01 ppm and 0.04 ppm obtained from aggregate mining by crushing rock [64]. The result is also greater than VOC: 0.30–0.95 in Okigwe, but less or equal to 0.48–48.00 ppm in Egbema, Imo, Nigeria, respectively [72]. The VOC result is above the 0.50 ppm (WHO, FMEnv) permissible limit. High content of VOC can lead to respiratory tract and eye irritations, nausea, headache, liver and kidney damage, as well as central nervous system. VOCs also have the potential to cause cancer [73].
CO2 ranged from 56.9 ± 0.19 to 528.3 ± 12.2 ppm, with the loading site having a lower value and milling recording the highest value, within 443 and 597 ppm of CO2 from the cement industry in Saudi Arabia [74]. However, the value of CO2 is below the 1000 ppm recommended upper limit (WHO) and ASTM D6245 (2002) and grossly lower than the CO2 content of 1500 and 5000 ppm for short- and long-term exposure time, respectively [75]. Therefore, no adverse health effects. The result is in tandem with the NISTIR 6729 report by [76], that carbon dioxide is not usually considered to be a health problem.
CO ranged from 2.41 ± 0.17 to 575.5 ± 722.5 ppm, with quarrying having the lowest content and milling with the highest content. The mean values at the three sites are greater than 0.48 ppm CO at the cement production plant in Ewekoro [77], greater or equal to 5.50 ± 0.50 CO at rock crushing sites in Ewekoro [77], and except for the loading site, whose CO concentrations were within 10–35 ppm limits (WHO, FMEnv, NAAQS and USEPA), others were all above. Breathing in air laden with high levels of CO could cause vomiting, dizziness, headache, nausea, heart-related diseases, angina, brain function reduction, unconsciousness and ultimately death at high concentrations [78]. It is reported that CO exposure has acute health implications, including weakness, dyspnoea, cardiac dysrhythmias, muscle fatigue, palpitations, confusion, hypotension, cardiac and respiratory arrest, impaired vision, pulmonary oedema, myocardial ischemia and coma [70, 78, 79]. Since the blood haemoglobin binding affinity to CO is more than 200 times, a high concentration of CO causes an increase in the level of carboxyhaemoglobin, especially in the brain, leading to various physical disabilities [70]. In contrast, several studies have reported no health effect at low CO concentration between 200, 1000 and 1200 ppm at a short time of exposure [79].
PM2.5 ranged from 27.03 ± 0.03 to 31.6 ± 0.04 μg/m3, with the loading site having the lowest value and quarrying with the highest content. The mean value of this study is far greater than PM2.5 concentrations (21, 15, 13, 13 μg/m3) in four sites operated by the cement industry in Riyadh, Saudi Arabia [74], and also greater than 0.065 ± 0.045 μg/m3 PM2.5 at the quarry site [77], but less than PM2.5 in India with 89.9 μg/m3 [80] and 2919 μg/m3 of PM2.5 [56]. The mean values of PM2.5 in the three study sites are above the 25 μg/m3 limit set by the United States Environmental Protection Agency and World Health Organization for PM2.5, but below 115 μg/m3 (FMEnv), 250 μg/m3 (NAAQS) and 35 μg/m3 (USEPA). The effect of high PM2.5 concentrations is felt on both the environment and human health [80]. High concentrations of PM2.5 induce the increase of low-visibility days [81,82,83], but also penetrate cerebral, vascular and nervous systems [84,85,86,87,88].
PM10 ranged from 306.2 ± 0.60 to 346.2 ± 128.4 μg/m3, with quarry having the lowest value and milling having the highest. The mean values were greater than or equal to PM10 (131, 107, 84 and 81 μg/m3) in the cement operational sites at Riyadh [74], ≥ the range (109.3—125.0 μg/m3) due to quarry activities in the Eastern Region of Ghana [45]. The mean PM10 in this study is above the 250 NNAAQS limit, greater than PM10 ranges from 56.50 ± 6.36 (quarry entrance) and less than 2,829.50 ± 12.02 μg/m3 (chippings deposition cum collection point) [89] and greater than (120 μg/m3) in ambient air quality by the cement industry in Jordan [10]. In this study, all the study sites recorded averages of PM10 above the environmental standards, which signifies a potential risk for cardiovascular and respiratory diseases caused by chronic exposure [90, 91]. PM10 content with differences greater than 10 μg/m3 may lead to a significant increase of chronic diseases for long-term exposure [92, 93]. It has been reported that PM could harm human health at even the lowest concentrations [54], further reported that cement-containing particles, e.g. PM10 and 2.5 in the atmosphere, have been reported to cause irritation and respiratory tract diseases (asthma, silicosis, chronic bronchitis), infections of the skin (for example, allergic dermatitis), as well as mucous membranes of the nasopharynx, oral cavity and digestive organs, etc. Many studies on the effect of particulate matter exposure from cement manufacturing reveal a high risk of chronic respiratory ailment [65, 94]. In a medical research report, a lung disease very peculiar to cement production and known as pneumoconiosis has been observed [95], and it is viewed as the most harmful and peculiar health hazard faced by cement industry workers, especially those at the crushing and packaging departments [95].
Above all, in developing countries like Nigeria, PM 10 and 2.5 concentrations around the neighbourhood of cement plants are usually higher than the allowable limit, and this increases the occurrences of the above-highlighted diseases among the inhabitants or population of the area [63]. Even in developed countries where PM concentrations are not exceeded from the permissible limit around cement plants, it has been reported that children living around the neighbourhood have suffered illnesses associated with PM [96]. Evidence of cancer cases and increased mortality rates among the neighbourhood around cement plants [97]
H2S ranged from 0.01 ± 0.005 to 8.3 ± 0.003 ppm, with milling having the lowest value and loading having the highest value. The value range of H2S in the ambient air is more than zero (0) value recorded around the cement factory in Ogun State, Nigeria [56], less than the H2S range of 0.08–0.33 ppm due to the cement factory operation [77], and less than the H2S ranges of 3.3–16.28 in the ambient air from the cement industry from Riyadh, Saudi Arabia [74]. The mean results of H2S from rock quarrying and milling are below the 8 ppm limit (FMenv) and above the 0.005 ppm limit (NAAQS), with loading site above the standards respectively. High content H2S may expose the workers to many symptoms such as disquiet, headache, fatigue and poor memory, as well as drowsiness, vertigo and eye irritation [70, 74].
In the quarrying site (Table 4, Fig. 4), ambient temperature varied from 32.50 to 35.85 °C, with a mean value of 33.5 °C, and the months of JF and JA were statistically different at p ≤ 0.05. In the milling site (Table 4, Fig. 4), temperature ranged from 32.11 to 35.85 °C, with a mean value of 26.04 °C and was statistically the same at p ≥ 0.05, and the loading site ranged from 33.15 to 33.85 °C and varied at p ≤ 0.05. The variation in atmospheric temperature in this study is suggested to be due to differences in the time of the day that the reading was made [70]. The temperature of the study is consistent with the reports of the ambient temperature obtained by [98] in Rivers State, [20] in Lagos State, [99] in Akwa Ibom State, and [70] in Imo State, 27.5–30.17 °C in Lafarge cement in Ogun State [56]. The mean values of temperature of the study were below the daily temperature limit of 36 °C stipulated by [100]. Relative humidity (RH) readings in the quarrying site ranged from 29.05 to 35.55%, with a mean value of 31.5%, and statistically varied at p ≤ 0.05 across the months. In the milling site, RH varied from 30.15 to 35.65%, with a mean value of 31.9%, and the loading site ranged from 29.75 to 35.65%, with a mean value of 32.5% below the 40–70% RH limit [100], below 74.5–85% in Lafarge cement [56] and ≤ relative humidity that varied from 88 to 98% with the mean value of 91.6% in Owerri, Imo State [70]. The mean values of wind speed (WS) in the quarry site ranged from 1.11 to 1.14 m/s, with a mean value of 1.15 (0.3 m/s), and in the milling site, WS ranged from 1.13 to 1.21 m/s, with a mean value of 1.15 m/s, and the loading site recorded WS ranging from 1.11 to 1.16 m/s with a mean value of 1.14 m/s, and wind speed in the three sites was statistically the same at the p ≥ 0.05 level of significance, but below the 11 m/s for 24 h limit [100].

Temporal variation of meteorological parameters in the study locations of cement production processes
In general, the rate of dispersion of air pollutants, their direction, absorption and transformation, as well as how long air pollutants remain in the atmosphere, is significantly influenced by meteorological or weather parameters such as temperature, humidity, wind speed and direction [44, 101]. Consequently, the meteorological parameters to a large extent influence the microclimate and the atmospheric condition of the study area.
From Table 4, a temperature peak (35.85 °C) was significantly observed between the months of May and June at the milling site, while the rock quarrying site and loading site maintained lower temperatures but also significant ones as well. This is because there are usually intense heat-generating processes during milling arising from the kiln, which ultimately raises the ambient temperature [102]. Use of heavy equipment like the bulldozers and pay loaders at the quarry site may also contribute to heat emissions. Additionally, the seasonal temperature variations arising from dry and wet periods may have also impacted the ambient atmospheric conditions. Such elevated temperature or heat observed in the study area over time could be responsible for the easily felt excessive heat wave and drought, reducing water supply for human and irrigation purposes within the local climate [103], and wildfires releasing more carbon dioxide around the region [103]. High temperature could also trigger chemical reactions/transformations of nitrogen oxide (NOx) and volatile organic compounds (VOCs) in the presence of solar radiation to form tropospheric ozone, which is a secondary pollutant [104]. Ground-level ozone is a significant contributor to climate change and acid rain deposition [104, 105] and is also responsible for photochemical smog or haze, reducing vision and constituting deleterious public health effects [105]. Ground-level ozone is notorious for reducing food security by disrupting ecosystem balance and the ability of green plants to undertake photosynthesis for food production [106]. In addition, epidemiological studies implicated short-term and long-term ozone exposure as a cause of respiratory irritation leading to cardiovascular sickness and death as well as severe asthma [107, 108].
The percentage of relative humidity relatively fluctuated through the sites, but it remained low between January and February (31 to 32%), reflecting the peak of the dry season in the Nigerian climate, while it was highest between July and August (35.65%), reflecting the rainy season. The relatively low humidity and dryness around the study area is indicative of the increased atmospheric effect of particulate matter and cement dust emissions arising from cement production processes [109]. RH has been found to influence the formation and deposition of air pollutants, especially ozone. While lower RH levels below 22% influence lower ozone formation, higher levels between 25 to 40% increase the formation of ozone in the atmosphere, while excessive RH from 50% inhibits it [110]. As noted, ozone being a climate change agent when in increased levels leads to global warming. Epidemiologically, low atmospheric moisture can lead to health issues such as respiratory discomfort, skin dryness and increased susceptibility to infections due to the drying of mucous membranes [111], which may be primarily associated with increased particulate matter in the air. It is suggested that particulate matter may be hygroscopic in nature, thereby reducing air moisture, condensation and rainfall, ultimately leading to drought and low water supply [112]. Epidemiological studies on the respiratory and cardiovascular effects of particulate matter are also well documented [84,85,86, 88, 109].
Again, wind speed remained relatively low (around 1.1–1.16 m/s) across all sites, indicating poor dispersion and dissolution rates of air pollutants and cement dust around the area, thereby accumulating more pollutants and extending their stay and potential transformation within the local atmosphere. The direction of the wind travelled downwards southeast (SE) and southeast-west (SEW) towards the neighbouring and surrounding villages and potentially laden with pollutants. Eventually, the people living around the area may begin to experience respiratory and cardiovascular health problems.
Thus, the combining effect of high temperature, low humidity and low wind speed suggests that airborne cement dust and associated pollutants (such as SO2, NOx and CO2) could persist in the atmosphere for extended periods with potential microclimate warming effects and health challenges around the cement-producing area.
Pearson product-moment correlation coefficient (r) analysis is instrumental in showing the underlying linear relationships in terms of strength and direction existing between the investigated air pollutants (CO, CO2, SO2, NO2, VOC, H2S, PM10 and PM2.5) and meteorological parameters (RH, temperature and wind speed) at the rock site, cement milling site and cement loading site. It goes a long way to show the extent of influence each of the variables under investigation has on one another and each other, which is critical in assessing air pollution dynamics in cement production sites. The results of the correlation analysis for the quarrying, milling and loading are presented in Table 5.
The result of the correlation analysis for quarrying revealed a weak negative correlation between SO2 and NO2 (r = − 0.461), VOC averagely negatively correlated with NO2 (r = − 0.544), and highly positively correlated with SO2 (r = 0.899). CO showed a moderate positive correlation with NO2 (r = 0.503) and CO2 (r = 0.577). PM2.5 recorded a negative correlation with NO2 (r = − 0.549) and positively correlated with CO2 (r = 0.632). Similarly, PM10 indicated moderate positive correlation with NO2 (r = 0.684), moderate negative correlation with SO2 (r = − 0.595), highly negative correlation with VOC (r = − 0.833), weakly positive correlation with CO (r = 0.424) and moderately negative correlation with PM2.5 (r = − 0.630), respectively. The correlation between CO and PM10 can be of common origins during the transportation of raw materials for cement production, which is in consonance with the findings of [113,114,115]. A weak positive correlation existed between H2S and PM2.5 (r = 0.496). Accordingly, moderate negative correlation occurred between temperature and NO2 (r = − 0.665), weakly negative correlation with CO2 (r = − 0.401) and CO (r = − 0.427), weakly positive correlation with PM2.5 (r = 0.400) and moderately positive correlation with H2S (r = 0.633), respectively. Similarly, RH showed a highly negative correlation with CO2 (r = − 0.756), moderate negative correlation with CO (r = − 0.519) and weak negative correlation with PM2.5 (r = − 0.497), which is in line with the report that PM2.5 concentration increases as the relative humidity decreases at the industrial zone [116], which is attributed to the role of relative humidity in cleaning the atmospheric pollutants in the area. RH recorded weak positive correlation with temperature (r = 0.438). WSP revealed moderate positive correlation CO2 (r = 0.529) and weak correlation with CO (r = 0.449) respectively. High wind speed reduces the concentration of pollutants as it disperses them [84].
From the milling site (Table 5), a highly positive correlation existed between SO2 and NO2 (r = 0.907). In the presence of atmospheric water vapour, NO2 and SO2 form sulfuric acid (H2SO₄) and nitric acid (HNO₃), respectively [117], forming acid rain [70, 117]. Accordingly, a highly positive correlation was recorded between VOC/NO2 (r = 0.967) and VOC/SO2 (r = 0.875), respectively. A weak positive correlation existed between CO2 and NO2 (r = 0.484), and a moderate positive correlation occurred between CO2 and VOC (r = 0.540). Meanwhile, CO was highly positively correlated with NO2, SO2 and VOC (r = 0.917), (r = 0.861) and (r = 0.884), respectively, and a moderate positive correlation occurred between CO/CO2 (r = 0.545). Similarly, high positive correlation occurred between PM2.5 and CO2 (r = 0.760) and weak positive correlation with CO (r = 0.423), and accordingly, weak negative association existed between PM10 and VOC (r = − 0.439), and moderate negative correlation occurred between PM10/PM2.5 (r = − 0.655). A weak negative association was also observed between H2S and SO2 (r = − 0.417). The result also indicated that moderate negative associations occurred between RH/NO2 (r = − 0.519) and RH/CO (r = − 0.577), and weak associations occurred between RH/VOC (r = − 0.402) and RH/CO2 (r = − 0.452), respectively. A moderate positive association existed between WSP/CO2 (r = 0.526).
From the loading site (Table 5), high positive correlation existed between SO2/NO2 (r = 0.853), VOC/NO2 (r = 0.953) and VOC/SO2 (r = 0.849), respectively. Statistically, the high correlation of SOx and NO2 in the atmosphere is emitted from anthropogenic activities, which agrees with [118], and SO2 is mainly produced from the combustion of fuel containing sulphur, energy production and households [119]. Weak positive associations existed between CO2/NO2 (r = 0.429) and CO2/SO2 (r = 0.411), respectively. Moderate relationships occurred between PM2.5/VOC (r = 0.511) and PM2.5/CO2 (r = 0.528), respectively. A weak negative association occurred between PM10/VOC (r = − 0.468) and moderately between PM10/PM2.5 (r = − 0.583), and conversely, [120] observed a remarkably strong positive correlation between PM10 concentration and PM2.5, respectively. Weak negative correlation occurred between RH/NO2 (r = − 0.456) and high negative association between RH/CO2 (r = − 0.722) and RH/PM2.5 (r = − 0.400), which is in tandem with the report that PM2.5 was negatively correlated with RH in West Delhi [121]. The negative relationship of PM with RH could be the washing effect of precipitation that washes off the pollutants from the atmosphere and decreases their concentration in the air [122, 123]. The high relative humidity is often associated with fog and rain events [124] and leads to a reduction of the incoming solar radiation due to the formation of an inversion layer, thus reducing the dispersal of the pollutants [123]. When the humidity is low, because of hygroscopic growth, PM2.5 concentration increases [125]. Meanwhile, a high positive association occurred between WSP/CO (r = 0.746), and a weak negative association occurred between WSP/temperature (r = − 0.458), against the report that wind speed has no effect on the concentration of air pollutants [121]. Inversely, [122] reported that wind speed does disperse or reduce the air pollutant (CO).
By implication, the strong positive and negative correlations existing between NO2 and VOC against temperature and against relative humidity across the three sites go a long way to show the significant relationship existing between meteorological conditions and pollutant concentrations. This corroborates the fact that higher temperatures and humidity levels might lead to dispersion or chemical transformations of these pollutants to ground-level ozone in the presence of solar radiation, which automatically reduces their concentration [104]. The strong positive correlation between fine particulate PM2.5 and CO2 could also suggest that both pollutants arise from combustion activities at the sites [33, 34]. Hence, these strong correlations existing between NO2, SO2 and VOC indicate that all of them emanate from a common fuel combustion source at the cement factory. Ultimately, understanding these relationships helps in pinpointing targeted air quality mitigation strategies such as emission reduction technologies at each of the cement production sites for public and occupational health protection. This will help in making informed regulatory and sanctionable decisions by environmental stakeholders and watchdogs against defaulters. Finally, this will also help monitoring programmes to take very seriously the integration of meteorological factors in the prediction of pollution episodes so as to optimize mitigation efforts.
The principal component analysis (PCA) was used to evaluate how the dry atmospheric pollutants are distributed in a cluster as well as the level of variation that exists among the variables. This was determined with the help of the varimax with Kaiser normalization rotated factor loading matrix [126]. An observation on the total variance (Table 6) shows that four components make up the total variance with initial eigenvalues of more than 1.0, although the eigenvalue for the four components is over 1 at 1.049, for the rock quarrying site (Table 7), 1.012 for the cement milling site (Table 8) and 1.411 for the cement loading site (Table 9). The four components whose eigenvalues are above 1 were rotated.
For the quarrying site, after the four components were rotated, the first principal component (PC1) accounted for 29.887% of variance, the second (PC2) accounted for 25.666% of variance, the third (PC3) accounted for 22.450% of variance and the fourth (PC4) accounted for 12.098% of variance (Table 7), with major fraction components from emissions, which might come from rock quarrying activities. From the quarrying site, based on these rotated component matrices, it was revealed that SO2 and VOC recorded high positive loadings in PC1 with correlation coefficients (CC) of 0.879 and 0.964, respectively. NO2, CO and PM10 revealed high negative loadings with CCs of − 0.662, − 0.463 and − 0.863, respectively. Similarly, the PC2 revealed CO2, CO and PM2.5 to have high positive loadings with CCs of 0.868, 0.686 and 0.549, respectively. Temperature and relative humidity showed high negative loadings of − 0.443 and − 0.943, respectively. From PC3, NO2 was negatively loaded with − 0.579, PM2.5, H2S and temperature were having high positive loadings of 0.705, 0.864 and 0.846, respectively. Ultimately, PC4 revealed CO2 and WSP with positive loading CC of 0.405 and 0.955 accordingly. A scree plot of these eigenvectors of PC as a function of factor number is shown in Fig. 5, having 11 variables (NO2, SO2, VOC, CO2, CO, PM2.5, PM10, H2S, Temp., RH, WSP) with a concave slope. Three principal components (PCs) were extracted from air quality results from the quarrying site with their corresponding component plot rotated in space as shown in Fig. 6.
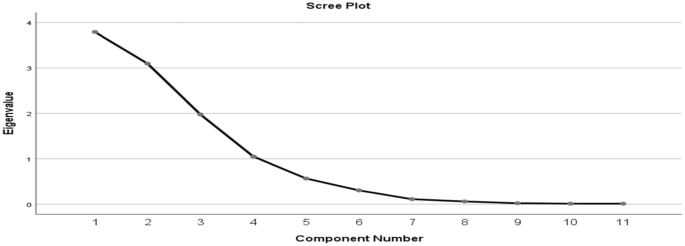
Scree plot of the eigenvalues of PC for air quality parameters in rock quarrying site
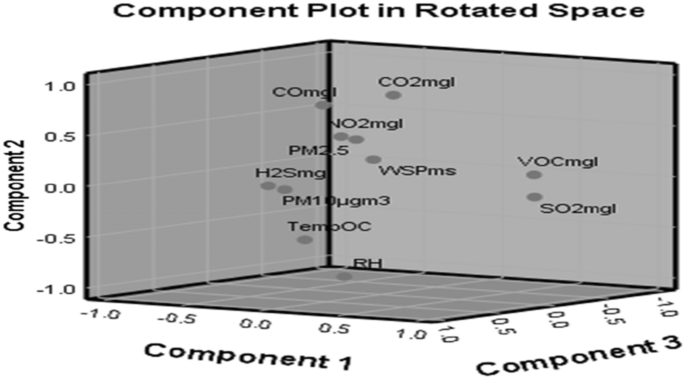
Component plot in rotated space of principal component analysis for rock quarrying
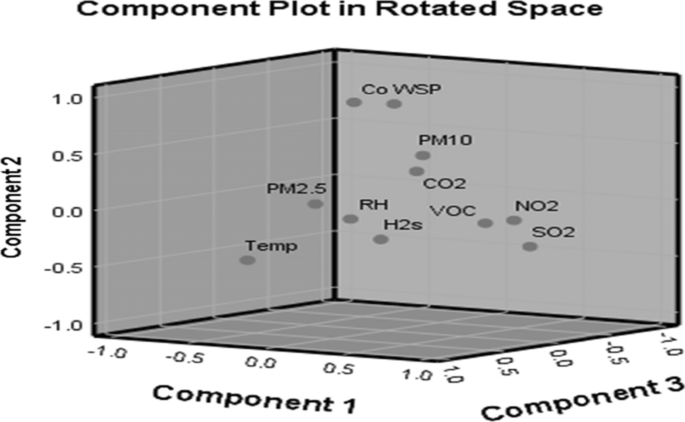
Based on the cement milling site, the eigenvalue for the four components is over 1 at 1.012, and the four components whose eigenvalues are ≥ 1 were rotated (Table 8). After rotation, PC1, PC2, PC3 and PC4 accounted for 36.135%, 20.217%, 15.712% and 17.472% of variance, respectively. Similarly, the rotated component matrices revealed that NO2, SO2, VOC and CO recorded high positive loadings with a correlation coefficient (CC) of 0.920, 0.955, 0.902 and 0.872 in PC1, respectively, and H2S revealed a high negative loading with a CC of − 0.590. PC2 showed that PM2.5, H2S and temperature recorded high positive loadings with CCs of 0.796, 0.510 and 0.492. PM10 recorded high negative loading with CC of − 0.848. PC3 revealed high positive loadings of CO2, PM2.5 and WSP with CCs of 0.752, 0.488 and 0.927, respectively. PC4 revealed CO2 with a high negative loading of − 0.437 alongside CO and WSP having high positive loadings with CCs of 0.712 and 0.702, respectively. A scree plot of these eigenvectors of PC as a function of factor number having eleven variables with slope gradient is shown (Fig. 7). Three principal components (PCs) were extracted from air quality results from the milling site with their corresponding component plot rotated in space, as shown in Fig. 8.
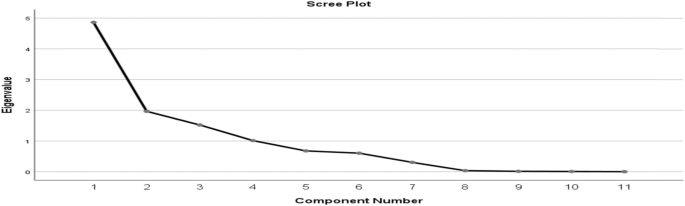
Scree plot of the eigenvalues of PC for air quality parameters in cement milling site
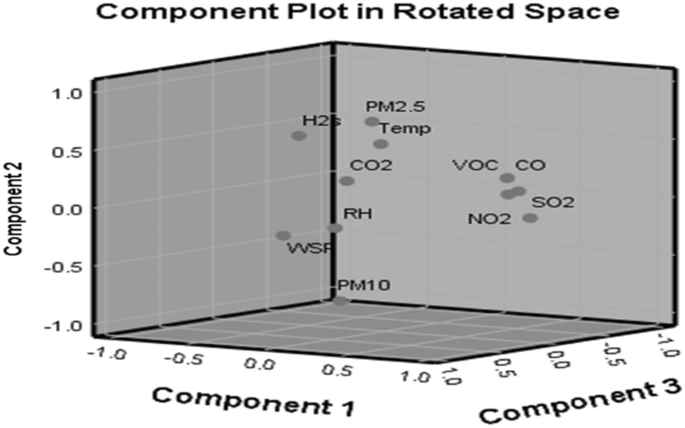
Component plot in rotated space of principal component analysis for cement milling
From the cement loading, again the initial eigenvalue for the four components is over 1 at 1.411. The total variance also showed that there are four components. The four components were rotated (Table 9). After rotation, PC1, PC2, PC3 and PC4 contributed 28.650%, 20.564%, 17.978% and 17.472% of variance, respectively, and the rotated component matrices revealed that NO2, SO2, VOC, CO2 and PM2.5 recorded high positive loadings with corresponding correlation coefficients (CC) of 0.950, 0.777, 0.937, 0.609 and 0.596, with PM10 and RH having negative loadings with CC of − 0.439 and − 0.587, respectively. PC2 showed CO2, CO, PM10 and WSP recording high positive loadings with CC of 0.582, 0.773, 0.599 and 0.845, while temperature and relative humidity recorded high negative loadings with corresponding coefficients of − 0.566 and − 0.413, respectively. The third component revealed that SO2 and PM10 were with high negative loadings, having coefficients of − 0.471 and − 0.454 with PM2.5 and temperature contributing high positive coefficients of 0.777 and 0.544, respectively. Lastly, the fourth component indicated that H2S recorded high positive loading, while RH recorded negative loading with the corresponding coefficient of 0.830 and − 0.422, respectively. A scree plot of these eigenvectors of PC as a function of factor number is shown in Fig. 9, having eleven variables with an undulating slope. Three principal components (PCs) were extracted from air quality results from the loading site with their corresponding component plot rotated in space, as shown in Fig. 10.

Scree plot of the eigenvalues of PC for air quality parameters in cement loading site
Component plot in rotated space of principal component analysis for cement loading
Table 10 shows the monthly air quality index for all the locations: quarrying site, milling site and loading bay. The result generally indicated PM10 and SO2 as pollutants constituting the monthly air quality and are in such a concentration that is hazardous or very unhealthy for people living and working within the cement factory vicinity (Table 10). The air quality index throughout the months (January to December) at the quarrying site was hazardous and very unhealthy, with the AQI category indicating ‘hazardous’ with values of 321, 308.8 and 422.9 for the months of January–February, March–April and November–December, respectively, while the months from May–June, July–August and September–October had a “very unhealthy” air quality with monthly AQI values of 234, 239 and 215, respectively. At the milling site, the same hazardous and very unhealthy air condition was recorded where months January–February, March–April and November–December had hazardous air quality with AQI values of 360.7, 349.9 and 433, respectively, while months May–June, July–August and September–October had very unhealthy air quality with values of 228.98, 275.5 and 241.9, respectively. Again, at the loading site, the same pattern played out where months January–February, March–April and November–December recorded ‘hazardous’ air, while May–June, July–August and September–October recorded ‘very unhealthy’.
The ambient air quality around the Lafarge cement factory presents a very threatening air quality categorized as hazardous in all the sampled sites. This calls for a health warning alert of emergency conditions, as the entire occupants living and working around the factory are more likely to be affected. The condition could be deleterious to their health, meaning everyone may experience more serious health effects. Sensitive people may experience more serious health effects. Thus, there is a need to educate the occupants about how much danger their health may be in.
In general, the situation at the Lafarge cement factory and its vicinity presents a very health-threatening atmospheric chemistry. The ambient air is majorly laden with substantial levels of NO2, SO2, VOC, CO2, CO, PM2.5 and PM10 at each of the quarrying, milling and loading sites within the cement factory. The milling site location generally recorded the highest levels of NO2, SO2, VOC, CO2, CO, PM2.5 and PM10 all through the months of the year, followed by the quarrying site and then the loading bay location, which supports the fact that pollutants occur at varying concentrations in time and space [44]; thus, there is a spatiotemporal variation in the rate and type of air pollutant [101] within the periods of cement production. However, more specifically, the rock quarrying site recorded the highest levels of PM (10, 2.5) and SO2 in support of the European Integrated Pollution Prevention and Control (EIPPC) [127], that quarrying site contributes significantly to the emission of dust and other pollutants. This high-level emission of PM and SO2 at the quarrying site is due to the grinding and crushing of limestone and clinker, the oxidation of cement raw materials containing sulphur at the extraction process [16, 17], as well as the interplay of emissions of sulphur through incomplete combustion of sulphur-containing fuels and wind-transported sulphur [44].
The milling site peaked high concentrations of CO, CO2, NO2 and VOC, more than the loading bay. CO, for instance, peaked at a high concentration at the milling site in May–June, then at the loading bay and quarrying site. This could be as a result of the incomplete combustion of fuel due to insufficient air mixing [31], in the combustion chambers of old and unmaintained stationary and mobile engines [44] and/or machines used for milling or from any other carbon-based material [128]. CO2 emissions were in high amounts at the milling site, arising during the calcination of limestone and decarbonization of such carbon material as tyres used for powering the combustion of the kiln as well as the fossil fuel combustion in the kiln. Similarly, NO2 was also in peak amounts at the mills, majorly escaping simultaneously with CO2 and CO as by-products of fossil fuel combustion [23] at high temperatures between 26 and 35 °C in gasoline or diesel engines [44]. VOC also peaked high and has a common mode of escape into the ambient air with CO, where, due to incomplete fuel combustion, the pollutants evolved simultaneously with CO.
The concentration of the gases at the loading bay relatively seemed to be at their lowest concentration when compared to the quarrying site and milling site, respectively. This may be justified by the presence of long verges of vegetation and shrubs around the area. However, the overall quality of atmospheric chemistry around the cement factory is inimical for people living and working within this environment.
The study is limited majorly by the inability of the management of the cement company to grant full and easy access to the researchers to interact with all their processes that may have significant pollution impact on the environment, due to company policy and bureaucracy. The researchers were only granted access to rock quarrying site, milling site and loading site which were reported in this study and may not be a full representation of the emission realities in cement industries. Again, the study did not investigate the health impact assessment and or implications of cement production emissions on the surrounding neighbourhood due to paucity of funds. Again, the air quality data reported here especially at the quarry may have been slightly influenced by traffic around the site since it is located along the expressway.
Further studies may try to break the jinx of company bureaucracy using environmental watchdogs to gain access to all the hidden processes.
The study assessed the effect of cement production processes on dry atmospheric chemistry.around and within the vicinity of Akamkpa Cross River State, South-South, Nigeria revealed that milling process contributed majorly to the increased levels of CO, CO2, SO2, NO2, VOC, H2S, PM2.5, PM10, followed closely by the operations at the quarrying site and then the loading bay site indicating that there is a spatio-temporal variation in air quality. Comparison of air pollutants to global environmental standards (EPA NAAQS, WHO, NNAAQS) showed significant exceedances from the permissible limits of CO, SO2, NO2, PM10 across the three sites; Rock quarrying site, milling site and loading site. Pearson product moment correlation revealed positive and negative correlation among and between the pollutants of interest suggesting that there is a linear source, location and relationship existing among the variables. Again, Varimax rotated principal component matrix for the three locations showed that four components make up the total variance with initial eigenvalues of more than 1.0 with high positive and negative loadings of CO, CO2, SO2, NO2, VOC, H2S, PM2.5, PM10 existing in clusters from different sources, ranging from emissions from incomplete combustion of fossil fuels, high temperature gasoline engine emissions and Sulphur containing fuels (CO, SO2, NO2, VOC) through dust emissions (PM2.5, PM10) to calcination and decarbonization of cement raw materials (CO2). Monthly air quality index report presented a hazardous and very unhealthy air quality across the three sites and was majorly laden with high levels of PM10 and SO2 as pollutants causing deterioration of air quality at both local and subsequent global scale. This is dangerous to workers and people living within Lafarge Holcim and the environment, and many other features of the study area may start developing unhealthy symptoms in future since most of these pollutants have cumulative or indirect impact. Hence, in the light of the aforementioned findings, it is recommended that workers in this company should use safety wears and gadgets to cover their sensory organs and those living within should relocate to a serene environment. The company should ensure that they conduct an environmental auditing of all their environmental aspects, regularly monitor their carbon foot prints so as to improve performance and make the data public to ensure transparency. Reduction in emissions from this industry must be attained by adopting improved and efficient technologies such as the use of electrostatic precipitators, gas scrubbers and dust filters to reduce emissions, as well as the use of water sprays especially at the quarry site. Adoption of alternative source of energy like solar powered, reduction in clinker to cement ratio, as well as eliminating CO2 gas from flue gases must be done by the company. The company must plant trees to buffer air pollutants at the production sites. Environmental watch dogs such as NESREA must ensure that Larfarge cement factory is upholding their environmental responsibility through regular monitoring of their activities and process interactions with the environment and issue sanctions and fines when necessary. NESREA must issue stricter environmental limits and emission restrictions to protected areas where emissions must not get to. NESREA must conduct an independent auditing of the company regularly and not rely on the company’s own and the result must be transparent and accessible. Awareness creation efforts on the health impact of cement factory emissions through key stakeholders (policy and decision makers, journalists, industrialists) as well as the inclusion of environmental education should be encouraged. The public must report excessive emissions and public concerns to NESREA, they must speak up and also demand public health protection strategies from the company.
No datasets were generated or analysed during the current study.
Not applicable.
This research work was jointly funded by the authors.
Not applicable.
Not applicable.
The authors declare no competing interests.
Springer Nature remains neutral with regard to jurisdictional claims in published maps and institutional affiliations.
Open Access This article is licensed under a Creative Commons Attribution-NonCommercial-NoDerivatives 4.0 International License, which permits any non-commercial use, sharing, distribution and reproduction in any medium or format, as long as you give appropriate credit to the original author(s) and the source, provide a link to the Creative Commons licence, and indicate if you modified the licensed material. You do not have permission under this licence to share adapted material derived from this article or parts of it. The images or other third party material in this article are included in the article’s Creative Commons licence, unless indicated otherwise in a credit line to the material. If material is not included in the article’s Creative Commons licence and your intended use is not permitted by statutory regulation or exceeds the permitted use, you will need to obtain permission directly from the copyright holder. To view a copy of this licence, visit http://creativecommons.org/licenses/by-nc-nd/4.0/.

Nwogu, F.U., Ubuoh, E.A., Kanu, C. et al. Effect of cement production processes on dry atmospheric chemistry in South-South Nigeria. Environ Sci Eur 37, 90 (2025). https://doi.org/10.1186/s12302-025-01135-4