Discrepancy in SARS-CoV-2 Infection Status Among PCR, Serological, and Cellular Immunity Assays of Nucleocapsids: A Historical Cohort Study - PubMed
Background/Objectives: Limited research has compared tests assessing humoral and cellular immunity related to SARS-CoV-2 infection. This study evaluated immunoglobulin G for nucleocapsid (IgG(N)) and T-spot for nucleocapsid (T-spot(N)) assays against polymerase chain reaction (PCR) test results for identifying infected individuals. Methods: This study included participants who had completed five blood samplings since their second COVID-19 vaccination between 9 September 2021 and 6 November 2022. Chemiluminescent immunoassay (CLIA) tests measured the humoral immune response, IgG(S) and neutralizing activity tests the immune status, and IgG(N) tests the infection history. For cellar immunity, T-spot(S) indicated immune status, and T-spot(N) indicated infection history. Results: The primary outcome was the proportion of individuals who tested positive for PCR and the proportion who tested positive for IgG(N) and T-spot(N). Overall, this study included 2104 participants. In the PCR-negative group, 1838 individuals tested negative for IgG(N), whereas 64 tested positive at least once. The geometric mean of IgG(S) at T5 was 1541.7 AU/mL in the IgG(N)-negative group and 3965.8 AU/mL in the IgG(N)-positive group, which was 2.6 times higher. In the PCR-positive group, 25 individuals tested negative for IgG(N), while 177 tested positive at least once. The geometric mean of IgG(S) at T5 was 2700.6 AU/mL in the IgG(N)-negative group and 5400.8 AU/mL in the IgG(N)-positive group, showing higher values in the IgG(N)-positive group. Conclusions: A discrepancy was noted between PCR test results and the IgG(N) and T-spot(N) determinations. Combining multiple assays is required to accurately identify the past-infected population.
COVID-19; SARS-CoV-2; cellular immunity; humoral immunity; nucleocapsid.
Kaneko is employed by Medical and Biological Laboratories, Co. (MBL, Tokyo, Japan). MBL imported the testing materials used in this study. Kaneko participated in the testing process; however, he was not involved in the research design and analysis. Kobashi and Tsubokura received a research grant from the Pfizer Health Research Foundation for research that is not associated with this study (from 1 December 2020 to 30 November 2022). All authors declare no other competing interests.
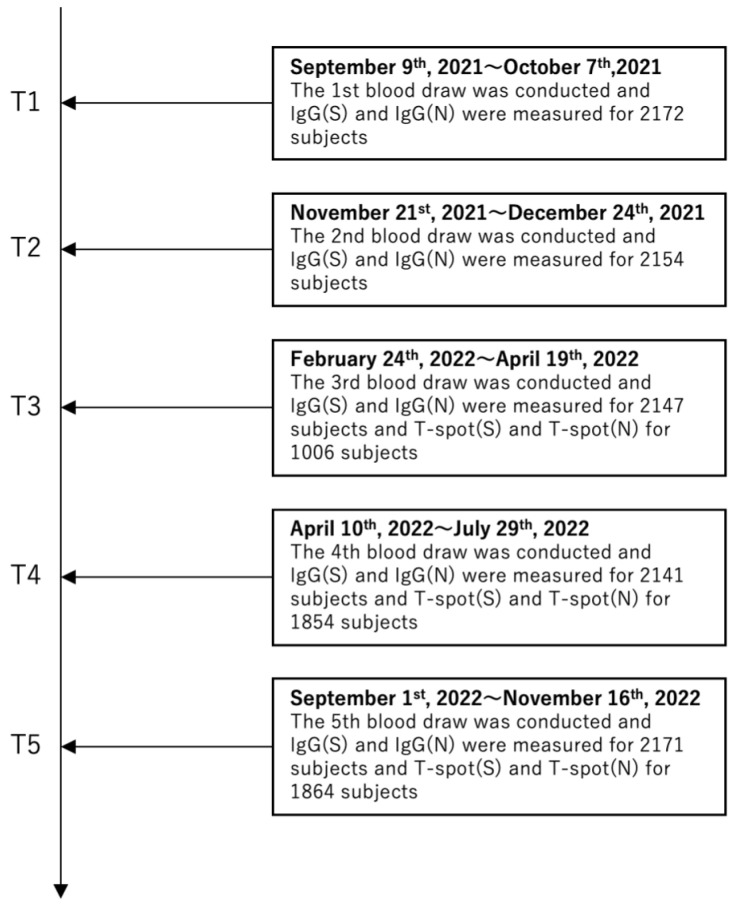
The timeline for the five blood samplings.
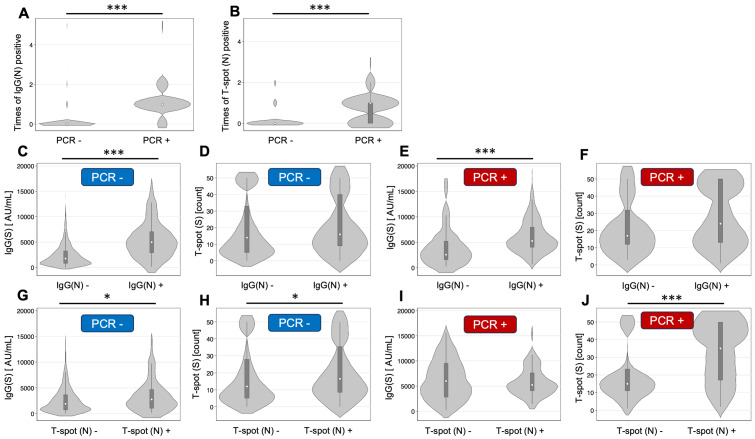
Relationships between different assays. (A) IgG(N)-positive times by the results of PCR. (B) T-spot (N)-positive times by the results of PCR. (C) IgG(S) titer at T5 by the group of IgG(N) results and negative PCR. (D) T-spot(S) at T5 by the group of IgG(N) results and negative PCR. (E) IgG(S) titer at T5 by the group of IgG(N) results and positive PCR. (F) T-spot(S) at T5 by the group of IgG(N) results and positive PCR. (G) IgG(S) titer at T5 by the group of T-spot (N) results and negative PCR. (H) T-spot(S) at T5 by the group of T-spot (N) results and negative PCR. (I) IgG(S) titer at T5 by the group of T-spot (N) results and positive PCR. (J) T-spot(S) at T5 by the group of T-spot (N) results and positive PCR. * p < 0.05, *** p < 0.001 with Wilcoxon rank sum test.