Lipids in Health and Disease volume 24, Article number: 212 (2025) Cite this article
In postmenopausal women, lower levels of sex hormone-binding globulin (SHBG) have been linked to various metabolic conditions. The association between SHBG levels and the presence of dyslipidemia was investigated in comparison with other sex hormones.
Data from 570 postmenopausal women were analyzed. To assess the relationship between circulating sex hormone concentrations and dyslipidemia, logistic regression and receiver operating characteristic (ROC) curve analyses were performed to assess the relationships.
Participants had a median age of 51.0 years (49.0–53.0). The multivariate analysis revealed that SHBG levels were significantly associated with dyslipidemia. Specifically, low SHBG levels correlated with hypertriglyceridemia and low high-density lipoprotein levels. The area under the curve (AUC) and the optimal SHBG level cutoff value for identifying the presence of dyslipidemia were 0.626 and 69.0 nmol/L, respectively. The AUCs for SHBG levels were highest for estradiol (E2), total testosterone (TT) and dehydroepiandrosterone sulfate (DHEAS) levels.
SHBG levels were significantly associated with dyslipidemia in postmenopausal women and outperformed E2, TT, and DHEAS levels. These findings highlight SHBG as a potential biomarker for dyslipidemia risk in postmenopausal women, warranting further research into its prognostic utility.
The global prevalence of dyslipidemia has increased over the past 30 years and has become a significant public health concern worldwide [1]. Dyslipidemia is typically defined by increased levels of total cholesterol, low-density lipoprotein (LDL) cholesterol, and triglycerides, along with decreased levels of high-density lipoprotein (HDL) cholesterol, and is recognized as a primary risk factor for cardiovascular disease [2].
The menopausal transition leads to increased LDL cholesterol and apolipoprotein B levels and vascular remodeling in women [3]. Menopause is characterized by changes in serum steroid concentrations including a significant decrease in estradiol (E2) levels and a slight decrease in testosterone levels [4]. In contrast, Pasquali et al. [5]. revealed no significant difference in sex hormone-binding globulin (SHBG) levels before and after menopause. While follicle-stimulating hormone (FSH) is essential for understanding the hormonal milieu in postmenopausal women [6], circulating SHBG, positively correlating with FSH [7], has been consistently associated with various metabolic abnormalities in the same group [8, 9]. SHBG is predominantly synthesized in the liver and is the binding protein for estradiol and testosterone, which regulate biological functions [10]. Although SHBG levels remain stable across menopausal transitions [5], numerous studies have indicated that SHBG levels are linked to metabolic disturbances and cardiovascular conditions in postmenopausal women [8, 9, 11, 12]. Although an association between SHBG levels and dyslipidemia in postmenopausal women has been previously reported [11, 13,14,15], it remains unclear whether SHBG levels are more strongly associated with dyslipidemia than the other sex hormones.
This study hypothesized that SHBG would show the strongest association with dyslipidemia among postmenopausal women, relative to other circulating sex hormones. To address this, SHBG, E2, total testosterone (TT), and dehydroepiandrosterone sulfate (DHEAS) were comparatively evaluated, providing novel insights into the relative hormonal contributions to lipid metabolism in this population.
The Japan Multi-Institutional Collaborative Cohort Study (J-MICC), launched in 2005, investigates genetic and environmental factors in lifestyle-related diseases, with a focus on cancer. A detailed description of this cohort study has been published previously [16, 17], and is also provided in Supplementary Table 1. This cross-sectional study used the baseline data from the J-MICC study included naturally menopaused women. The research protocol was reviewed and approved by the ethics committees of all participating institutions. Written informed consent was obtained from all individuals prior to participation. Further details are provided in Supplementary Table 1.
In this study, the participants were postmenopausal women with available serum hormone data in the J-MICC study. Natural menopause was defined as the cessation of menstruation for at least 12 consecutive months unrelated to surgery or other obvious causes [18].
Participants were excluded if baseline data were missing including lipid, fasting status of blood samples, and age data, or if they had been diagnosed with premature ovarian insufficiency, or using hormone therapy at enrollment.
Participants were asked to complete a questionnaire on lifestyle and medical conditions and provide a blood sample. The participants completed a self-administered questionnaire that included questions on anthropometric factors and lifestyle. Additionally, the participants were queried regarding their age at menopause onset and the underlying cause. The participants were also asked about hormone therapy history including details on the duration of use and age at initiation and cessation of therapy.
Body mass index (BMI) was calculated by dividing self-reported weight (kg) by the square of height (m²) and was used as a proxy measure of adiposity. Smoking habits were categorized into three groups: individuals who have never smoked, those with a history of smoking, and current smokers. “Not current drinker” was defined as a daily alcohol intake of less than 20 g/day, based on prior research indicating that even low alcohol consumption may increase the risk of cardiovascular disease in Asian populations [19]. Physical activity was evaluated using a format based on the International Physical Activity Questionnaires [20]. It was quantified in metabolic equivalent tasks (METs), calculated as METs-hours per day by multiplying the reported duration of each activity by its corresponding intensity, as previously described [21].
Serum SHBG, E2, TT, and DHEAS levels were quantified using immunoradiometric assay, liquid chromatography-tandem mass spectrometry and radioimmunoassay, respectively. Details of assay sensitivity and variability are available in Supplementary Table 2. Dyslipidemia, hypertension, and diabetes were defined based on established clinical criteria, as detailed in Supplementary Table 3 [22,23,24,25,26,27,28].
Continuous variables were assessed with the Wilcoxon test, and categorical variables with the chi-squared test. Data are reported as medians (IQR) or frequencies (%).
Logistic regression was employed to evaluate the relationship between the baseline values of four serum hormone measures, SHBG, E2, TT, and DHEAS levels, and the presence of dyslipidemia. To investigate the effect of the 4 serum hormone measures on the presence of dyslipidemia, the following variables were included as independent predictors in the multivariate logistic regression models. In Model 1, age, BMI, physical activity, drinking habits, and smoking status were adjusted for all 570 participants. In Model 2, additional adjustments were made for confounding variables including the presence of hypertension and diabetes along with the variables from Model 1. Model 2 only included 323 participants with complete blood glucose, HbA1c, and glucose-lowering medication data. Associations are expressed as odds ratios (ORs) with corresponding 95% confidence intervals (CIs). Furthermore, for the hormone measure that demonstrated a significant association with dyslipidemia in the multivariate analysis, additional analyses were conducted by categorizing the hormone level into quartiles to evaluate the gradient relationship with the risk of dyslipidemia. A sensitivity analysis was performed, restricted to participants without obesity, defined as BMI < 25 kg/m² [29],.
Furthermore, multiple regression analyses were conducted to evaluate the associations of SHBG, E2, TT, and DHEAS levels with LDL-cholesterol cholesterol, triglyceride, and HDL cholesterol levels. The covariates in Models 1 and 2 were aligned with those used for the logistic regression analysis.
The areas under the curve (AUCs) of SHBG, E2, TT, and DHEAS levels for the presence of dyslipidemia were calculated using a receiver operating characteristic curve (ROC) analysis including sex hormones 1 by 1, and cut-off values for the presence of dyslipidemia were determined. Additionally, the AUCs of SHBG, E2, TT, and DHEAS levels were compared using the DeLong method [30]. Statistical significance was set at a P value less than 0.05.
Among the 791 individuals initially eligible, 221 were excluded due to missing baseline data, resulting in a final analytical cohort of 570 participants. A flowchart outlining the selection process is provided in Fig. 1. Additional analyses were performed after excluding 247 participants without data for blood glucose or HbA1c levels, thus 323 participants remained. Table 1 presents the baseline characteristics of the study cohort. The participants’ median age was 51.0 years (49.0–53.0). Additionally, the median (interquartile range) lipid parameters were as follows: total cholesterol, 221.0 mg/dL (199.0–242.0); triglycerides, 94.0 mg/dL (71.0–132.3); HDL-cholesterol, 65.5 mg/dL (56.7–76.6); and LDL-cholesterol, 129.6 mg/dL (111.6–150.9). At baseline, individuals with dyslipidemia exhibited significantly lower SHBG levels compared to those without dyslipidemia (P < 0.001), with median values of 65.2 nmol/L (48.3–86.4) and 80.6 nmol/L (60.4–99.1), respectively. In contrast, no significant differences were observed in E2, TT, or DHEAS levels between individuals with and without dyslipidemia. Median E2 levels were 2.5 pg/mL (1.1–4.1) in individuals with dyslipidemia and 2.6 pg/mL (1.3–4.1) in those without (P = 0.370); TT levels were 106.7 pg/mL (80.8–144.4) vs. 110.5 pg/mL (81.8–145.8) (P = 0.394); and DHEAS levels were 751.5 ng/mL (509.5–1096.8) vs. 800.5 ng/mL (553.8–1184.3) (P = 0.113).
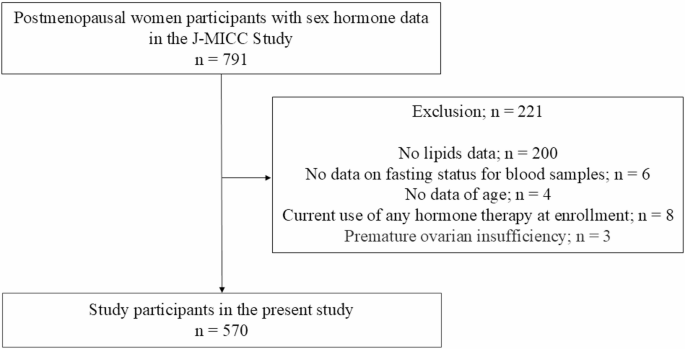
A flow diagram of the participants selection
The ORs for the univariate and multivariate logistic regression models for the presence of dyslipidemia are presented in Table 2. Multivariate logistic regression analysis in Model 2 demonstrated a significant association between SHBG levels and the presence of dyslipidemia (OR: 0.745, 95% CI: [0.576–0.958], P = 0.022). Similarly, in Model 1, SHBG levels were significantly associated with dyslipidemia, aligning with the findings in Model 2 (OR: 0.728, 95% CI: [0.598–0.884], P = 0.001). In addition, multivariable logistic regression analyses were conducted after excluding patients undergoing treatment for dyslipidemia (Supplementary Table 4). In Model 1, SHBG levels were significantly associated with the presence of dyslipidemia (ORs: 0.757, 95% CIs: [0.610–0.934], P = 0.010), whereas in Model 2, this association was not significant (ORs: 0.786, 95% CIs: [0.591–1.036], P = 0.092). In the sensitivity analysis, a significant association between the SHBG levels and dyslipidemia was also observed among participants without obesity (ORs: 0.688, 95% CIs: [0.523–0.896], P = 0.005), as shown in Supplementary Table 5.
Furthermore, in the multiple regression analyses that evaluated the relationships between SHBG, E2, TT, and DHEAS levels and LDL-cholesterol, triglyceride, and HDL-cholesterol levels, SHBG levels had a significant negative correlation with triglyceride levels (β = -0.217, P < 0.001) and a significant positive correlation with HDL cholesterol levels (β = 0.136, P = 0.016), whereas no significant association was observed with LDL-cholesterol levels (β = -0.062, P = 0.296), as shown in Supplementary Table 6. Among the sex hormones except SHBG levels, E2 levels were positively associated with HDL cholesterol levels (β = 0.131, P = 0.012). In addition, an exploratory analysis was conducted to examine the association between SHBG quartiles and dyslipidemia risk. Supplementary Table 7 presents that higher SHBG levels were associated with lower odds of dyslipidemia, displaying a significant inverse trend observed across quartiles (P for trend = 0.046), thereby suggesting a potential graded relationship.
The AUC and cutoff values for the presence of dyslipidemia were presented using an ROC curve analysis (Table 3). The AUC and optimal cutoff values for SHBG levels were 0.626 and 69.0 nmol/L, respectively. Figure 2 shows the ROC curves demonstrating the associations of SHBG, E2, TT, and DHEAS levels with dyslipidemia. Table 4 lists the results for the comparison of AUCs for SHBG, E2, TT, and DHEAS levels. The AUC for SHBG was significantly higher than those for E2, TT, and DHEAS, with P values of 0.005, 0.001, and 0.022, respectively.

Area under the receiver operating characteristic curve showing the ability of SHBG, E2, TT, DHEAS for the presence of dyslipidemia. Abbreviations: SHBG, sex hormone-binding globulin; E2, estradiol; TT, Total testosterone; DHEAS, dehydroepiandrosterone-sulfate
The main study findings for postmenopausal women participants were: (1) SHBG levels were significantly associated with dyslipidemia, (2) SHBG levels were positively correlated with HDL cholesterol levels and inversely correlated with triglyceride levels, and (3) the AUC for SHBG levels was the highest among those for E2, TT, and DHEAS levels. The optimal cutoff value for SHBG levels in identifying dyslipidemia was determined to be 69.0 nmol/L.
Although the primary role of circulating SHBG is to bind sex hormones and regulate their bioavailability, recent studies have demonstrated that SHBG also plays an active role in androgen signaling and other functions [31]. These findings highlight the multifaceted nature of SHBG and its broad implications in metabolic and hormonal regulation.
Over the past few decades, low SHBG levels have consistently been linked to an increased risk of developing various metabolic disorders [8, 9, 11]. and in this study, SHBG was significantly correlated with dyslipidemia. Importantly, reduced SHBG levels have been linked to insulin resistance and a heightened risk of developing type 2 diabetes mellitus, irrespective of other sex hormones, in both sexes [10]. Strain et al. [32] have previously documented that insulin inhibits SHBG synthesis, suggesting that hyperinsulinemia resulting from insulin resistance contributes to reduced SHBG levels. Insulin resistance is often accompanied by hypertriglyceridemia and reduced HDL cholesterol levels [33], with the former primarily attributed to the overproduction of very low-density lipoproteins [33], whereas the latter may result from increased hepatic triglyceride lipase and accelerated clearance of HDL cholesterol [34]. In the present study, low SHBG levels were associated with hypertriglyceridemia and low HDL cholesterol levels in postmenopausal women, which is consistent with previous research [11]. These findings further support the link between SHBG levels and insulin resistance.
Khoudary et al. [35] revealed that E2 levels are associated with HDL cholesterol function during menopausal transition. In line with this finding, the present study demonstrated a positive correlation between E2 and HDL cholesterol levels in postmenopausal women. Although low HDL cholesterol levels are known to be associated with an increased risk of coronary artery disease [36], evidence also links very high HDL cholesterol levels to adverse cardiovascular outcomes [37]. Therefore, further research is necessary to establish optimal management strategies for estradiol deficiency in postmenopausal women including E2 hormone therapy and target-setting approaches.
Although the association between E2 and SHBG levels and dyslipidemia in postmenopausal women has been consistently reported, the relationship between testosterone and dyslipidemia in these women remains unclear because evidence both supports and opposes [13, 38, 39]. In this study, no significant association between testosterone levels and dyslipidemia was observed. Previous studies have demonstrated a significant relationship between testosterone levels and dyslipidemia, including in participants with a higher average age than those in the present study [38, 39]. Triglyceride levels are the highest between 10 and 14 years after menopause [40] which suggests that age might be a contributing factor to these conflicting findings.
In this study, the association between SHBG and dyslipidemia differed from that observed in the case of E2 and TT. SHBG functions as an estradiol and testosterone binding protein, regulating various biological processes [10]. In postmenopausal women, biologically active free hormone levels are substantially reduced [41, 42]. Therefore, the observed relationship between SHBG and dyslipidemia might reflect sex steroid activity-independent mechanisms, suggesting the potentially direct role of SHBG in lipid metabolism.
Noyan et al. [13] reported a positive correlation between DHEAS and HDL-cholesterol levels. Although the association between DHEAS, HDL cholesterol levels and dyslipidemia was not statistically significant in this study, there were trends suggesting a relationship.
The present findings indicated that SHBG levels could be the most reliable indicator of dyslipidemia among E2, TT, and DHEAS levels, as suggested by the AUC comparisons. Thus, these findings suggest the importance of SHBG levels in relation to dyslipidemia. Although this study demonstrated the potential utility of SHBG in identifying dyslipidemia, its discriminatory ability alone, as reflected by the AUC, was suboptimal. Accordingly, SHBG should be considered as part of a broader risk assessment framework, in conjunction with other clinical parameters, to enhance diagnostic accuracy.
The strength of this study is that it is the first to comprehensively compare the associations of dyslipidemia with SHBG, E2, TT, and DHEAS. Several limitations should be acknowledged. Primarily, its cross-sectional design restricts the interpretation of any causal link between circulating sex hormones and dyslipidemia. Second, this study population was limited to Japanese individuals. Consequently, the potential for selection bias cannot be excluded, which limits the generalizability of the findings to other ethnic groups. Third, smoking status and alcohol consumption were self-reported, which may have introduced inaccuracies. Nonetheless, previous studies have indicated that self-reported data can be useful for assessing smoking status and drinking behaviors [43, 44], and the lifestyle data collected in the present study were considered valid. Fourth, the present study lacks data on several covariates that could potentially influence dyslipidemia, such as dietary patterns [45], thyroid hormones [46], visceral fat indicator (e.g., waist circumference), and an insulin resistance marker (e.g., insulin resistance homeostasis model assessment). Moreover, both thyroid function and insulin resistance reportedly affect SHBG levels [10, 47]. Therefore, the absence of relevant markers, including thyroid hormones and surrogate insulin resistance markers, represents an additional limitation. Finally, data on FSH, a key hormone for characterizing the hormonal status in postmenopausal women, were not available in this study. However, as FSH is significantly positively correlated with SHBG [7], such absence is unlikely to substantially compromise the clinical relevance of the present results.
In conclusion, among postmenopausal women, SHBG levels were most strongly associated with dyslipidemia among E2, TT, and DHEAS levels. This study also determined that the optimal SHBG cutoff value for the presence of dyslipidemia was 69.0 nmol/L. These findings highlight SHBG as a promising biomarker for identifying postmenopausal women at increased risk of dyslipidemia. Future studies should focus on monitoring postmenopausal women with SHBG levels above this threshold for the development of dyslipidemia.
Data are available upon reasonable request. Details can be found on the J-MICC Study website (http://www.jmicc.com/).
- AUCs:
-
Areas under the curve
- BMI:
-
Body mass index
- CIs:
-
Confidence intervals
- DHEAS:
-
Dehydroepiandrosterone sulfate
- E2:
-
Estradiol
- FSH:
-
Follicle-stimulating hormone
- HDL:
-
Cholesterol high density lipoprotein cholesterol
- IRMA:
-
Immunoradiometric assay
- LC-MS/MS:
-
Liquid chromatography-tandem mass spectrometry
- LDL-cholesterol:
-
Low density lipoprotein cholesterol
- METs:
-
Metabolic equivalents
- ORs:
-
Odds ratios
- RIA:
-
Radioimmunoassay
- ROC:
-
Receiver operating characteristic curve
- SHBG:
-
Sex hormone-binding globulin
- TT:
-
Testosterone
We thank all the contributors to the J-MICC study. Contributors to the J-MICC study are listed at the following site. (as of Mar 2023): https://jmicc.com/en/contributors. This study was supported by Grants-in-Aid for Scientific Research for Priority Areas of Cancer (No. 17015018) and Innovative Areas (No. 221S0001) and by the Japan Society for the Promotion of Science (JSPS) KAKENHI Grant (No. 16H06277 and 22H04923 [CoBiA]) from the Japanese Ministry of Education, Culture, Sports, Science and Technology.Additionally, we would like to thank Editage (www.editage.com) for English language editing.
The present study was approved by the Institutional Ethics Committee of the Kyoto Prefectural University of Medicine (approval number: ERB-C-3202 at 2024) and was conducted in accordance with the Declaration of Helsinki.
The authors declare no competing interests.
Springer Nature remains neutral with regard to jurisdictional claims in published maps and institutional affiliations.
Open Access This article is licensed under a Creative Commons Attribution 4.0 International License, which permits use, sharing, adaptation, distribution and reproduction in any medium or format, as long as you give appropriate credit to the original author(s) and the source, provide a link to the Creative Commons licence, and indicate if changes were made. The images or other third party material in this article are included in the article’s Creative Commons licence, unless indicated otherwise in a credit line to the material. If material is not included in the article’s Creative Commons licence and your intended use is not permitted by statutory regulation or exceeds the permitted use, you will need to obtain permission directly from the copyright holder. To view a copy of this licence, visit http://creativecommons.org/licenses/by/4.0/.

Ichikawa, T., Okada, H., Hamaguchi, M. et al. Association of sex hormone-binding globulin and dyslipidemia with Japanese postmenopausal women: a cross-sectional study. Lipids Health Dis 24, 212 (2025). https://doi.org/10.1186/s12944-025-02634-2
Received:
Accepted:
Published:
DOI: https://doi.org/10.1186/s12944-025-02634-2